Fig. 5
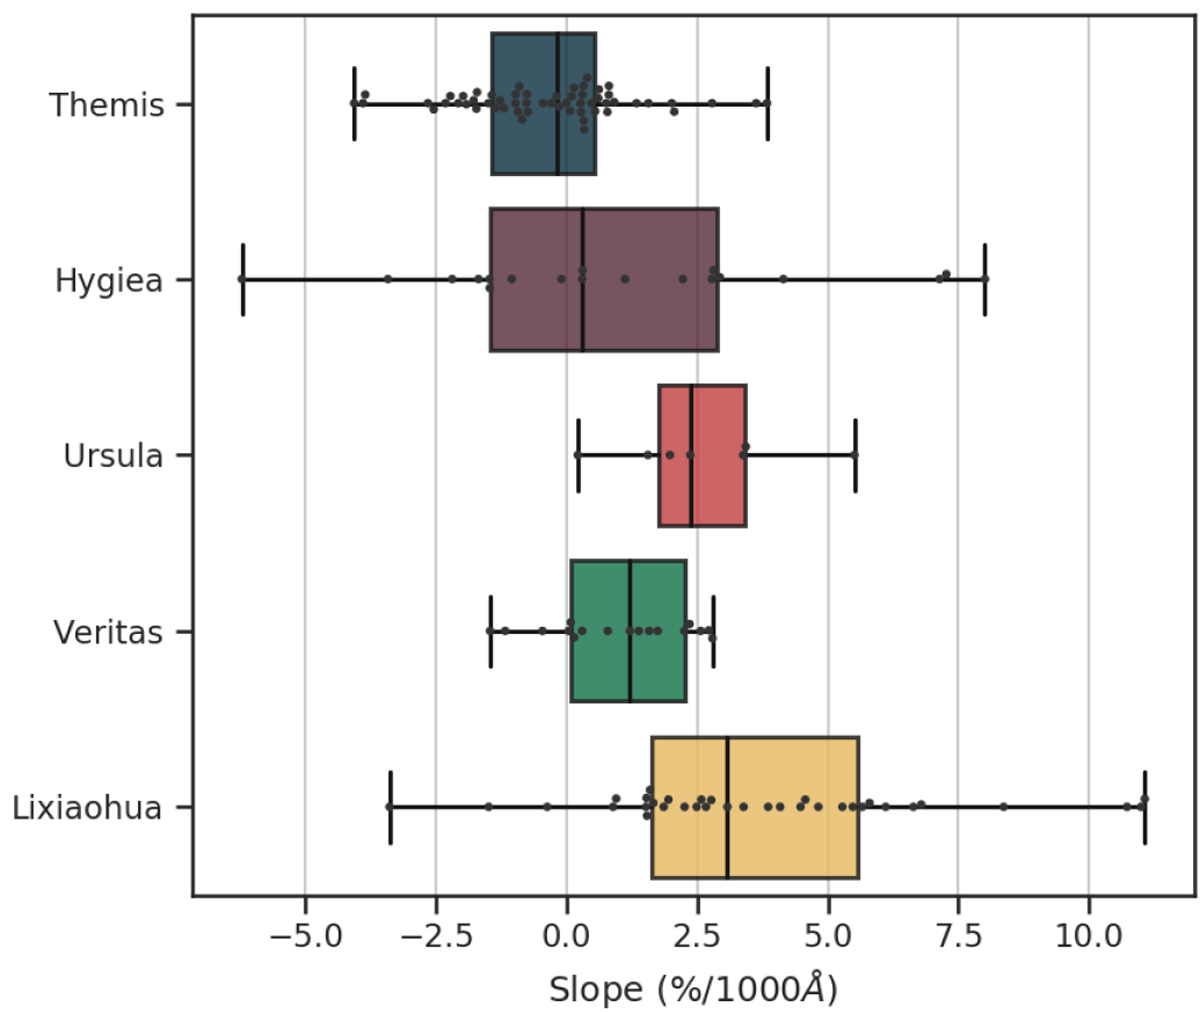
Whisker plot of the visible slope distribution in each family. The boxes represent the average and standard deviation of the slopedistribution, while the solid black line inside of the box represents the median. The black dots represent single slope measurements of family members, with the error bars showing the maximum and minimum values.
Current usage metrics show cumulative count of Article Views (full-text article views including HTML views, PDF and ePub downloads, according to the available data) and Abstracts Views on Vision4Press platform.
Data correspond to usage on the plateform after 2015. The current usage metrics is available 48-96 hours after online publication and is updated daily on week days.
Initial download of the metrics may take a while.