Fig. 7.
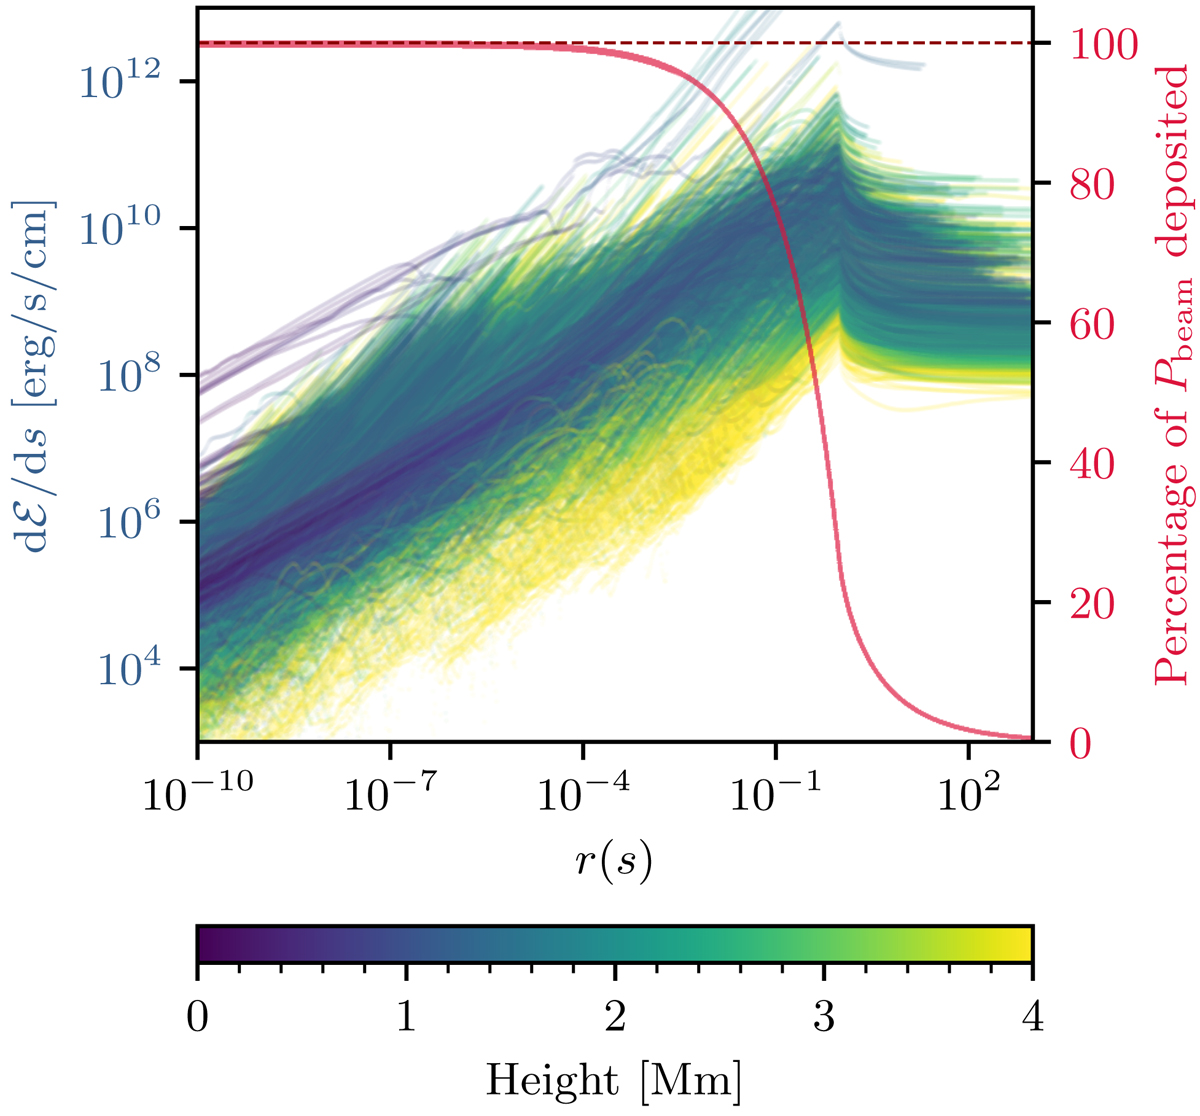
Energy deposition as a function of r(s) (Eq. (31)). The deposited power per distance, dℰ/ds, is plotted along the trajectories of a representative subset of the electron beams in a simulation with δ = 4 and p = 0.2, with colours indicating the height above the photosphere. For each beam, the corresponding proportion of the initial beam power that has been deposited at each r(s), given by ![]() , is indicated by a red curve. These red curves are all overlapping.
, is indicated by a red curve. These red curves are all overlapping.
Current usage metrics show cumulative count of Article Views (full-text article views including HTML views, PDF and ePub downloads, according to the available data) and Abstracts Views on Vision4Press platform.
Data correspond to usage on the plateform after 2015. The current usage metrics is available 48-96 hours after online publication and is updated daily on week days.
Initial download of the metrics may take a while.