Fig. 6.
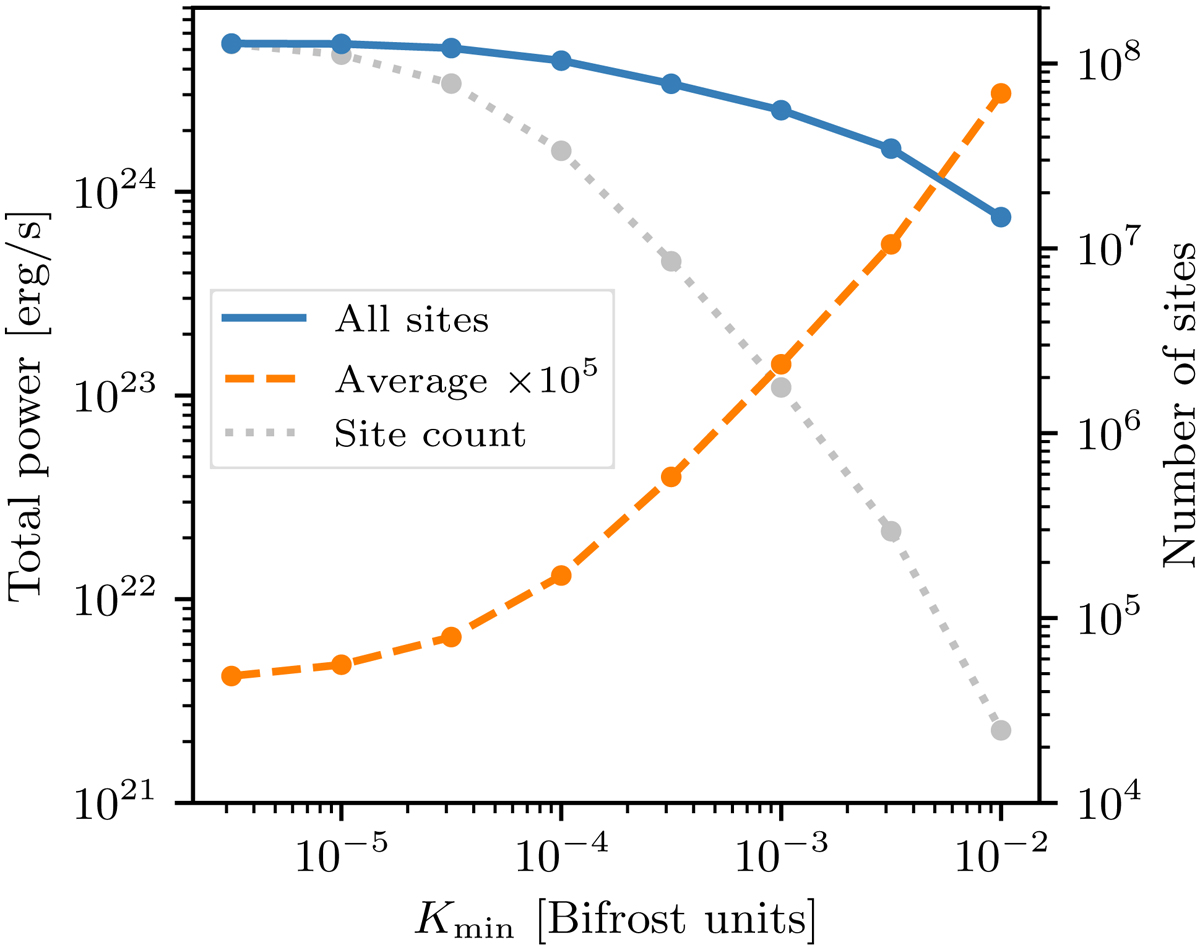
Variation in acceleration power (Eq. (6)) with the reconnection factor threshold Kmin, for a simulation with δ = 4 and p = 0.2. The solid curve is the total power for all included reconnection sites, and the dashed curve is the average power per site (multiplied by 105 for composition purposes). The total numbers of included sites are shown in the dotted curve. Short-range beams have been filtered out in the manner discussed in Sect. 2.3.2.
Current usage metrics show cumulative count of Article Views (full-text article views including HTML views, PDF and ePub downloads, according to the available data) and Abstracts Views on Vision4Press platform.
Data correspond to usage on the plateform after 2015. The current usage metrics is available 48-96 hours after online publication and is updated daily on week days.
Initial download of the metrics may take a while.