Fig. 13.
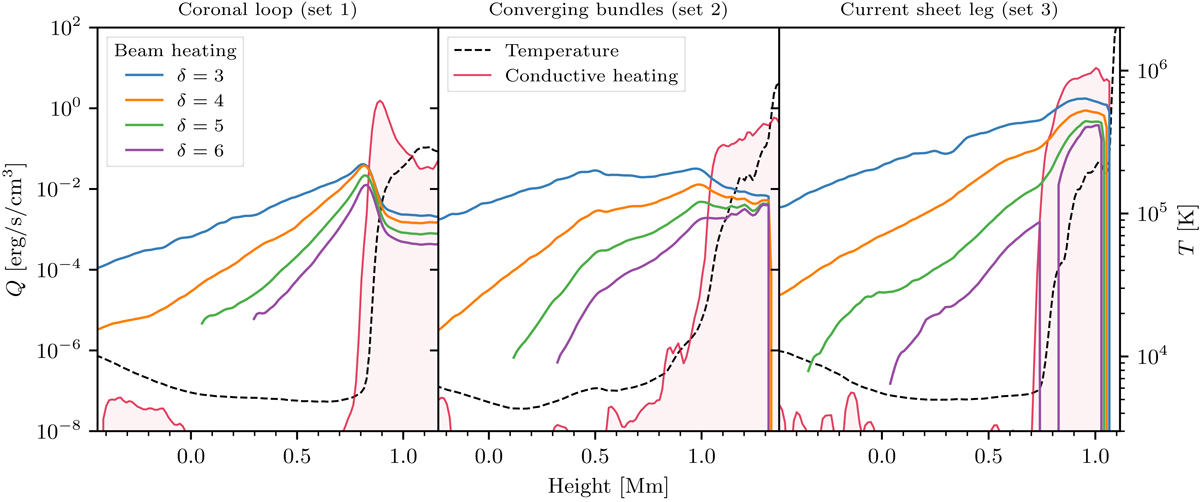
Horizontal averages of heating due to electron beams and thermal conduction with height along the three selected sets of electron trajectories. The averages are taken over the grid cells for which the aggregated Qbeam exceeds its 75th percentile within each horizontal layer. The dashed line shows the corresponding average temperature profile. We note that the height axes have the same extent, but separate bounds.
Current usage metrics show cumulative count of Article Views (full-text article views including HTML views, PDF and ePub downloads, according to the available data) and Abstracts Views on Vision4Press platform.
Data correspond to usage on the plateform after 2015. The current usage metrics is available 48-96 hours after online publication and is updated daily on week days.
Initial download of the metrics may take a while.