Fig. 10.
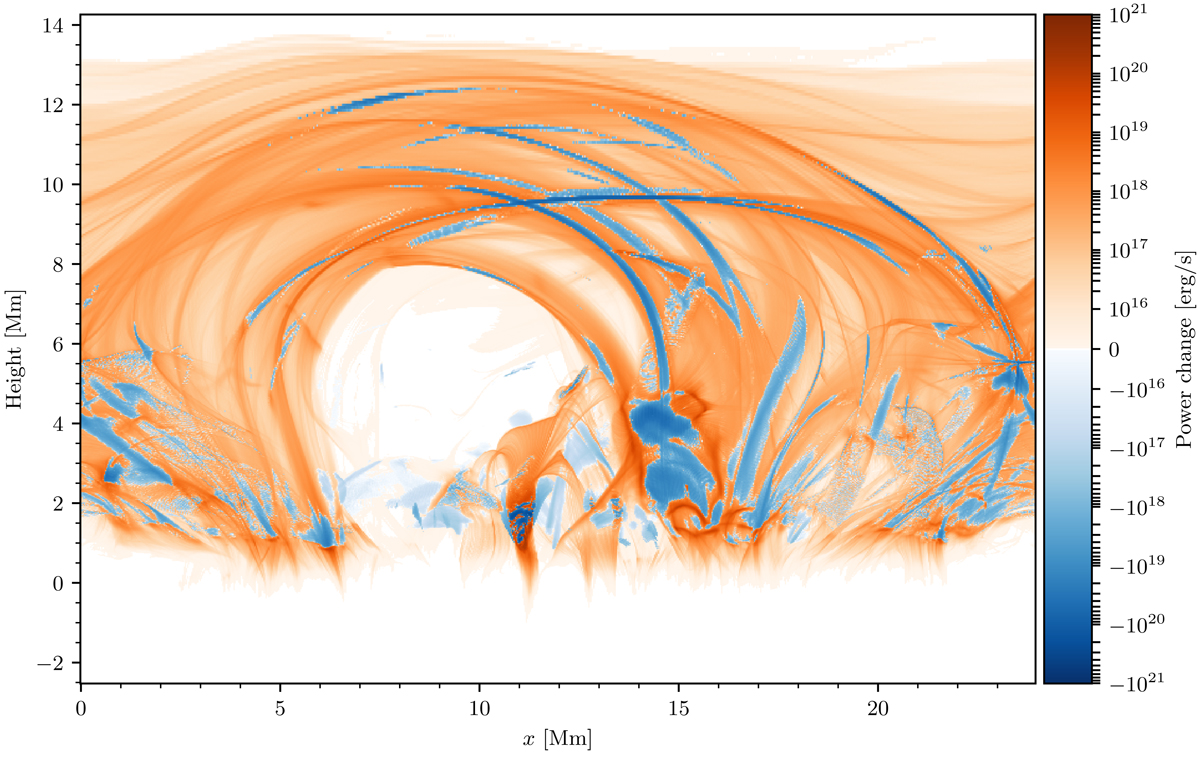
Change in heating power in each grid cell due to the inclusion of acceleration and transport of non-thermal electrons. The power changes are accumulated along the y-axis of the simulation snapshot. Blue regions indicate a net reduction of thermal energy compared to the case without non-thermal electrons, which is due to the fraction p of the local reconnection energy being injected into accelerated electrons instead of heating the ambient plasma. Orange regions show where the non-thermal electron energy eventually is deposited into the plasma as heat. The simulated beams have δ = 4 and p = 0.2.
Current usage metrics show cumulative count of Article Views (full-text article views including HTML views, PDF and ePub downloads, according to the available data) and Abstracts Views on Vision4Press platform.
Data correspond to usage on the plateform after 2015. The current usage metrics is available 48-96 hours after online publication and is updated daily on week days.
Initial download of the metrics may take a while.