Fig. 5.
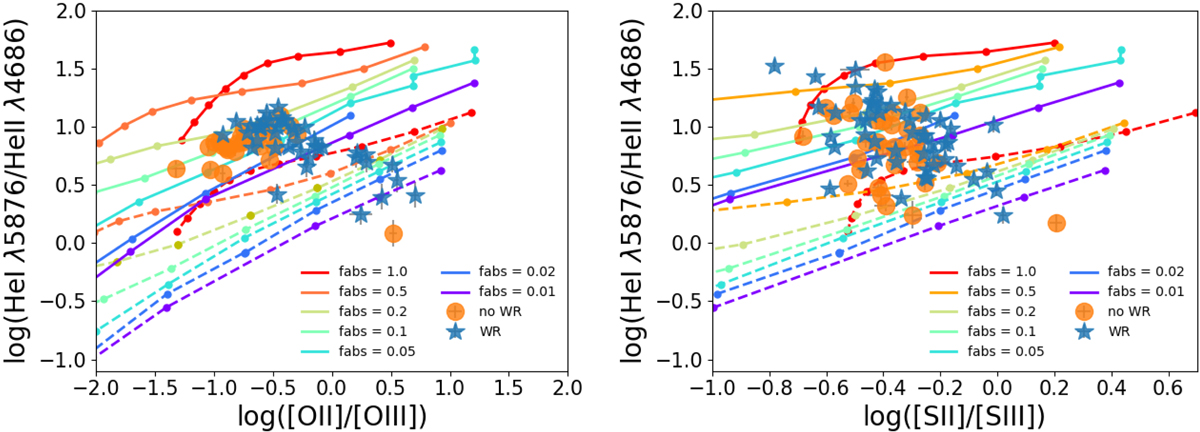
Relation between the emission-line ratio He I/He II and the line ratios [O II]/[O III] for 68 objects of the control sample at z > 0.02 (at left), and [S II]/[S III] for another 84 objects at z < 0.02 (at right). Different symbols represent objects with (blue triangles) and without (orange circles) an observed WR bump. The lines represent predictions from models using BPASS 2.1 SEDs with an IMF with x = −1.35 and an upper mass limit of 300 M⊙ considering different fractions of absorbed ionizing photons. Solid lines stand for models at 4 Myr with Z* = Zg = 0.0022, while dashed lines represent models at 6 Myr with Z* = 10−5 and Zg = 0.0022. Log U decreases towards the top right corner of each panel.
Current usage metrics show cumulative count of Article Views (full-text article views including HTML views, PDF and ePub downloads, according to the available data) and Abstracts Views on Vision4Press platform.
Data correspond to usage on the plateform after 2015. The current usage metrics is available 48-96 hours after online publication and is updated daily on week days.
Initial download of the metrics may take a while.