Fig. 2.
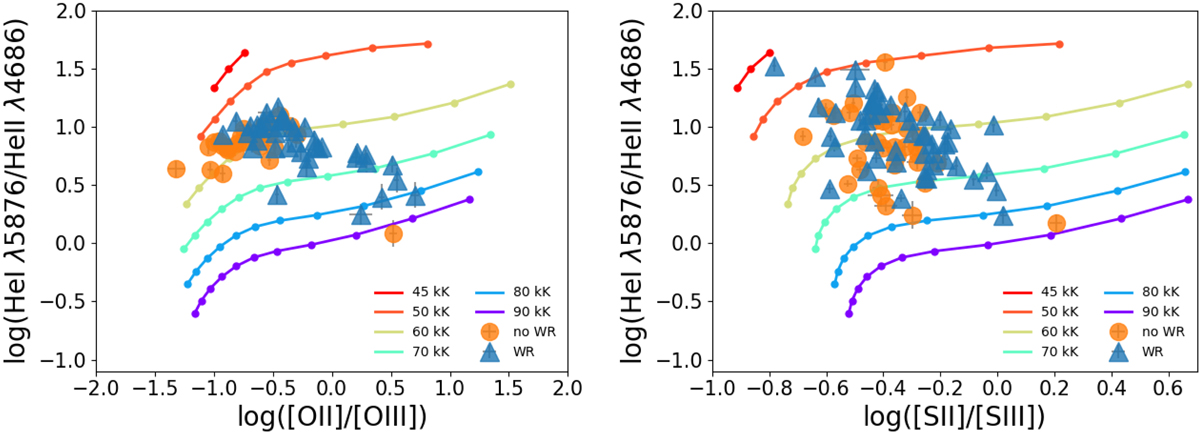
Relation between the emission-line ratio He I/He II and other optical emission-line ratios, such as [O II]/[O III] for 68 objects of the control sample at z > 0.02 (at left), and [S II]/[S III] for another 84 objects at z < 0.02 (at right). The different symbols represent objects with (blue triangles) and without (orange circles) an observed WR bump. The solid lines represent models at different black-body temperatures of the ionizing source. The points with lower log U are at the upper right of each sequence.
Current usage metrics show cumulative count of Article Views (full-text article views including HTML views, PDF and ePub downloads, according to the available data) and Abstracts Views on Vision4Press platform.
Data correspond to usage on the plateform after 2015. The current usage metrics is available 48-96 hours after online publication and is updated daily on week days.
Initial download of the metrics may take a while.