Fig. 1.
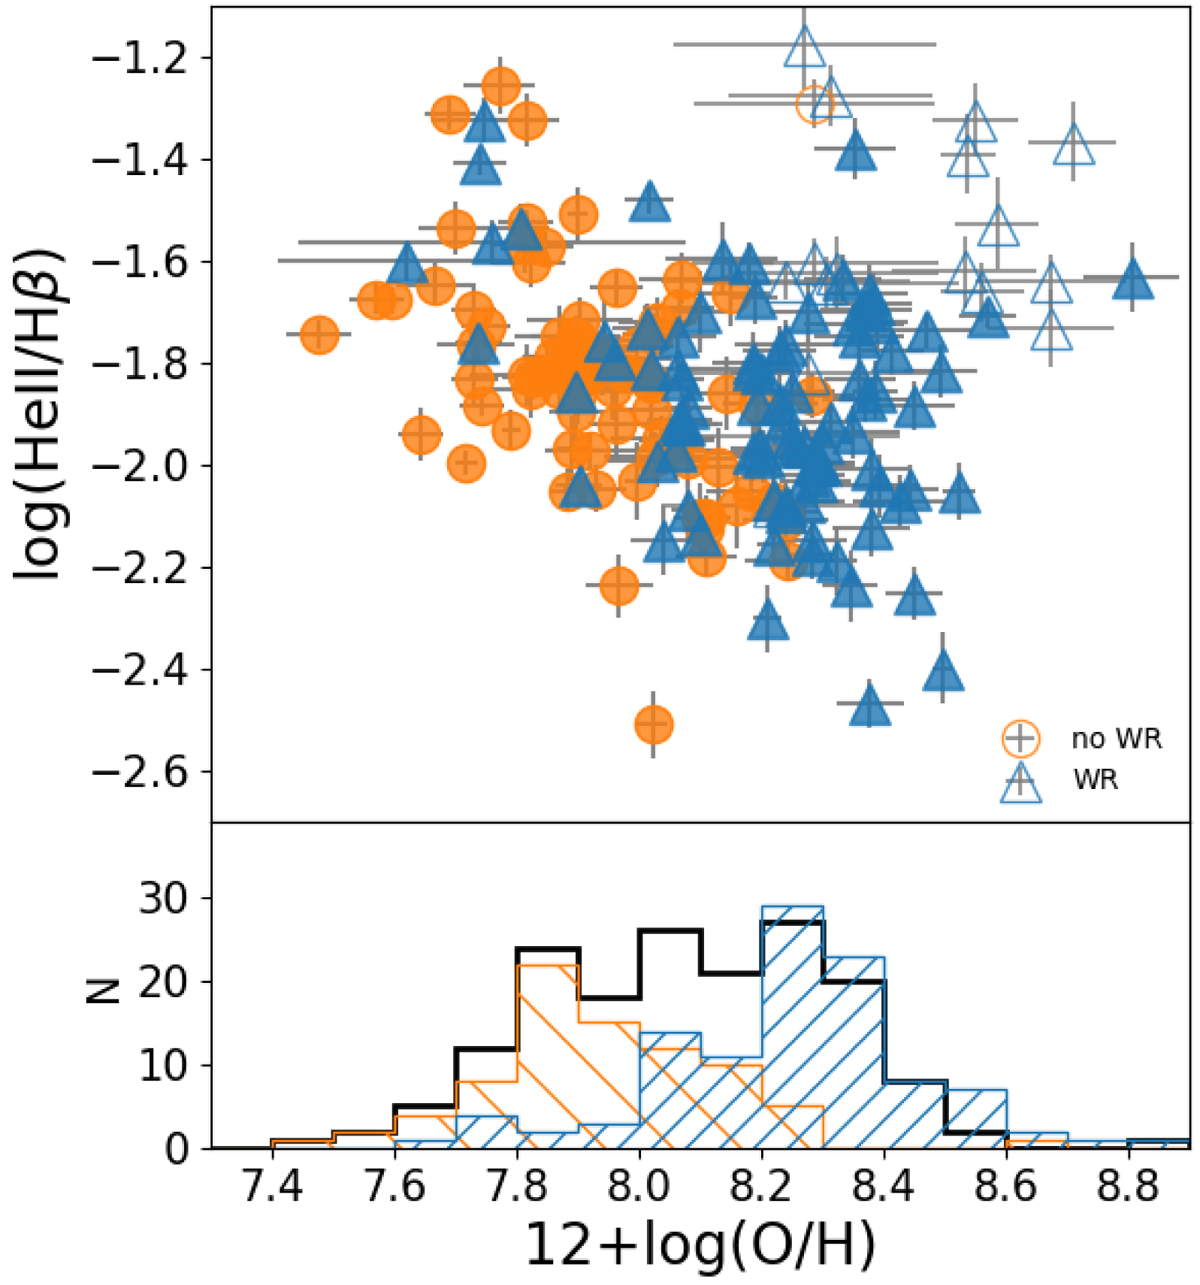
Top panel: relation between log(He II/Hβ) and the total oxygen abundance calculated using HCM for objects of the control sample both with the emission-line at [O III] λ4363 Å (filled symbols) and without it (empty symbols). Different symbols represent galaxies with a detected bump of WR stars (blue triangles) or without one (orange circles). Bottom panel: histogram of the 12 + log(O/H). The black line corresponds to the oxygen abundance distribution for the whole sample, while blue and orange hatched histograms represent the oxygen abundance distributions for WR and nonWR galaxies, respectively.
Current usage metrics show cumulative count of Article Views (full-text article views including HTML views, PDF and ePub downloads, according to the available data) and Abstracts Views on Vision4Press platform.
Data correspond to usage on the plateform after 2015. The current usage metrics is available 48-96 hours after online publication and is updated daily on week days.
Initial download of the metrics may take a while.