Open Access
Fig. 7.
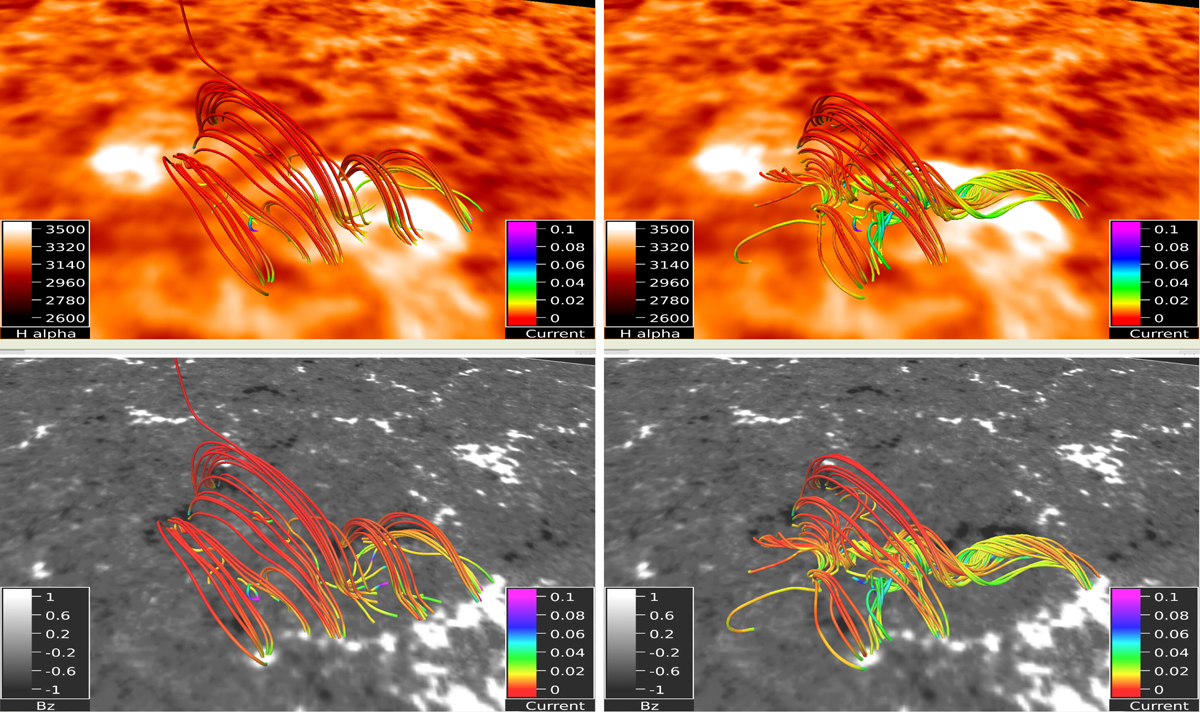
Top row: Hα images taken at 16:13 UT during the eruption phase with an overplotted, overlying coronal field (left panel) and the magnetic flux skeleton that holds the filament (right panel). Bottom row: HMI magnetograms taken at 16:15 UT with the same overplotted magnetic field lines.
Current usage metrics show cumulative count of Article Views (full-text article views including HTML views, PDF and ePub downloads, according to the available data) and Abstracts Views on Vision4Press platform.
Data correspond to usage on the plateform after 2015. The current usage metrics is available 48-96 hours after online publication and is updated daily on week days.
Initial download of the metrics may take a while.