Free Access
Fig. 9.
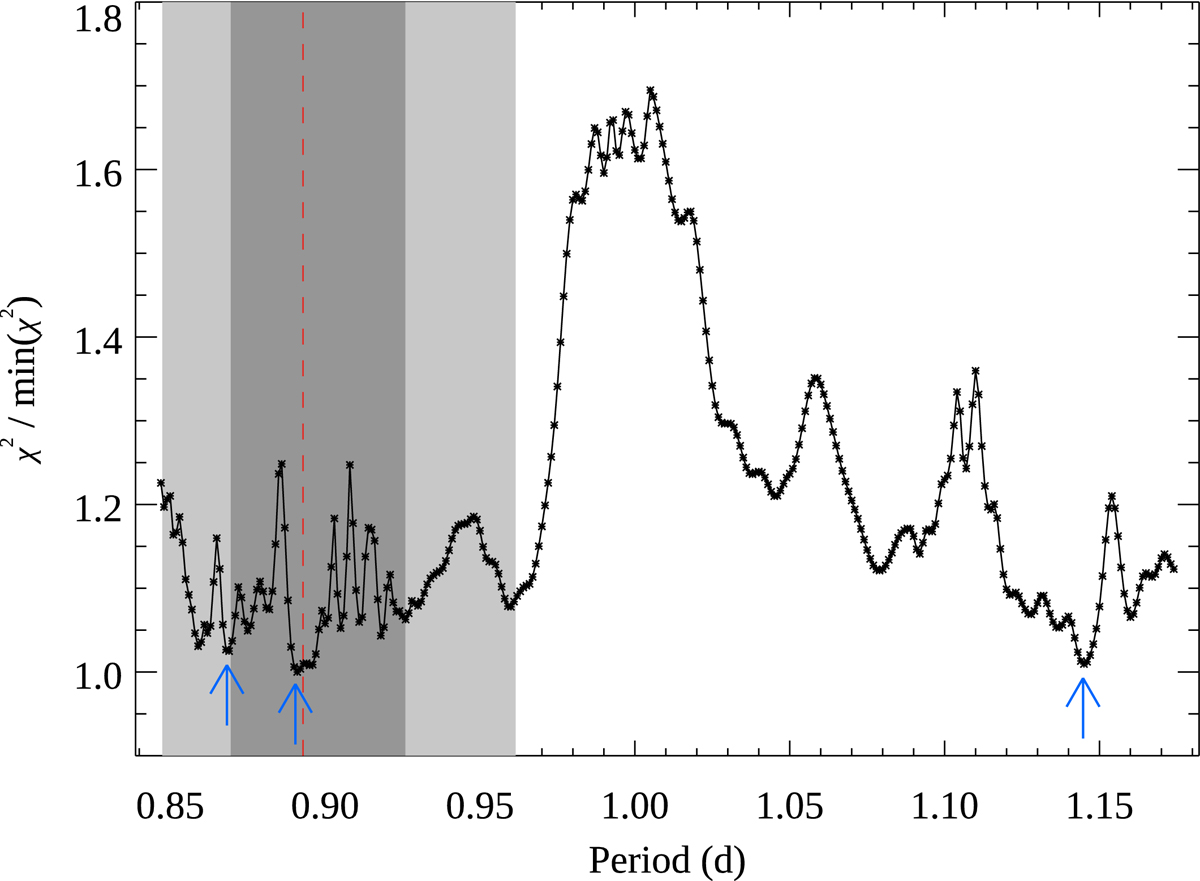
Relative χ2 of the fit to Stokes V LSD profiles as a function of rotational period. The vertical dashed line and the shaded regions correspond to the rotational period determined by Che et al. (2011) and the corresponding 1–2σ error bars. The arrows indicate the three rotational periods discussed in the text.
Current usage metrics show cumulative count of Article Views (full-text article views including HTML views, PDF and ePub downloads, according to the available data) and Abstracts Views on Vision4Press platform.
Data correspond to usage on the plateform after 2015. The current usage metrics is available 48-96 hours after online publication and is updated daily on week days.
Initial download of the metrics may take a while.