Fig. 3.
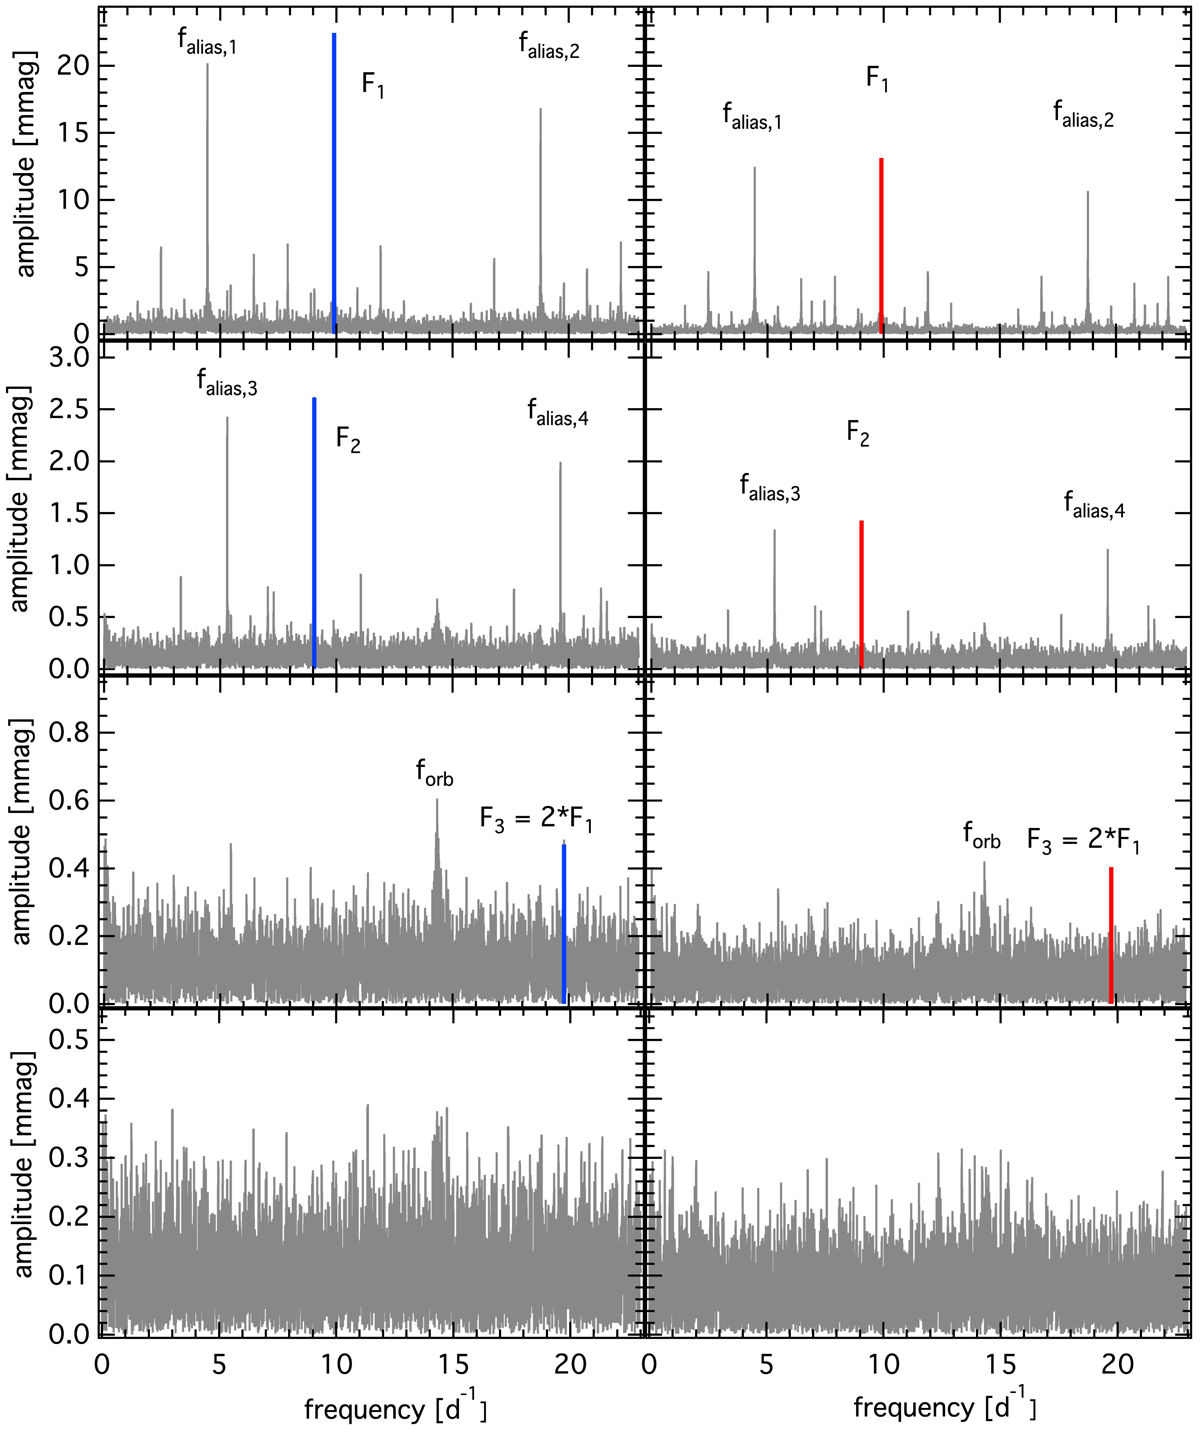
Amplitude spectra of the BRITE-Constellation data obtained in 2016: BAb blue filter data are shown on the left side, UBr red filter data on the right side. Top panels: amplitude spectra of the original data with F1 identified, second panels: amplitude spectra after pre-whitening F1, third panels: those after pre-whitening F1 and F2, and bottom panel: residual amplitude spectra after pre-whitening all significant frequencies. An explanation for the identified alias frequencies is given in the text.
Current usage metrics show cumulative count of Article Views (full-text article views including HTML views, PDF and ePub downloads, according to the available data) and Abstracts Views on Vision4Press platform.
Data correspond to usage on the plateform after 2015. The current usage metrics is available 48-96 hours after online publication and is updated daily on week days.
Initial download of the metrics may take a while.