Free Access
Fig. B.1.
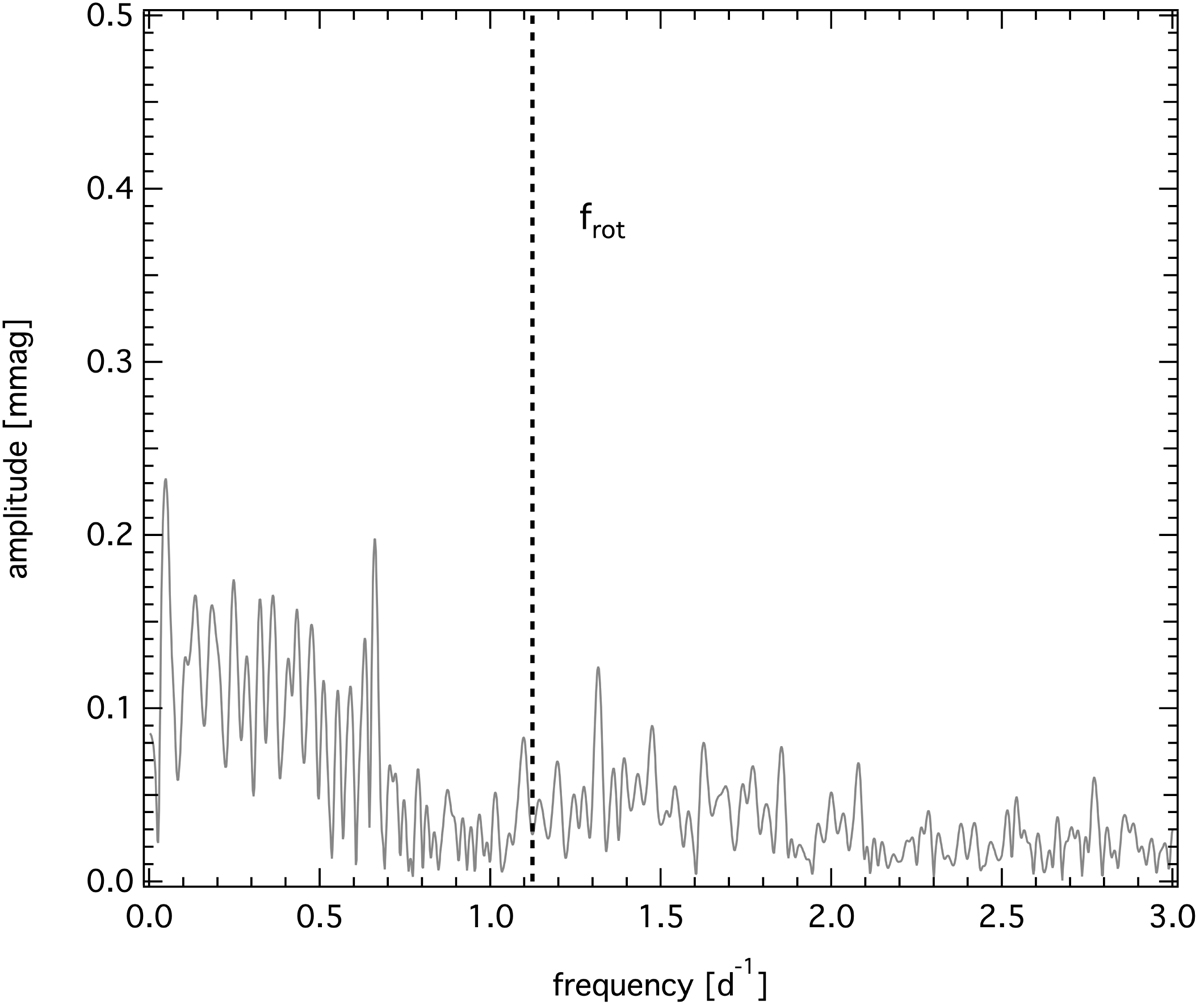
Zoom into the low-frequency domain of the amplitude spectrum of the original TESS data before application of a Gaussian filter. The position of the rotation frequency as determined by Che et al. (2011) is indicated with a dashed line.
Current usage metrics show cumulative count of Article Views (full-text article views including HTML views, PDF and ePub downloads, according to the available data) and Abstracts Views on Vision4Press platform.
Data correspond to usage on the plateform after 2015. The current usage metrics is available 48-96 hours after online publication and is updated daily on week days.
Initial download of the metrics may take a while.