Fig. 13.
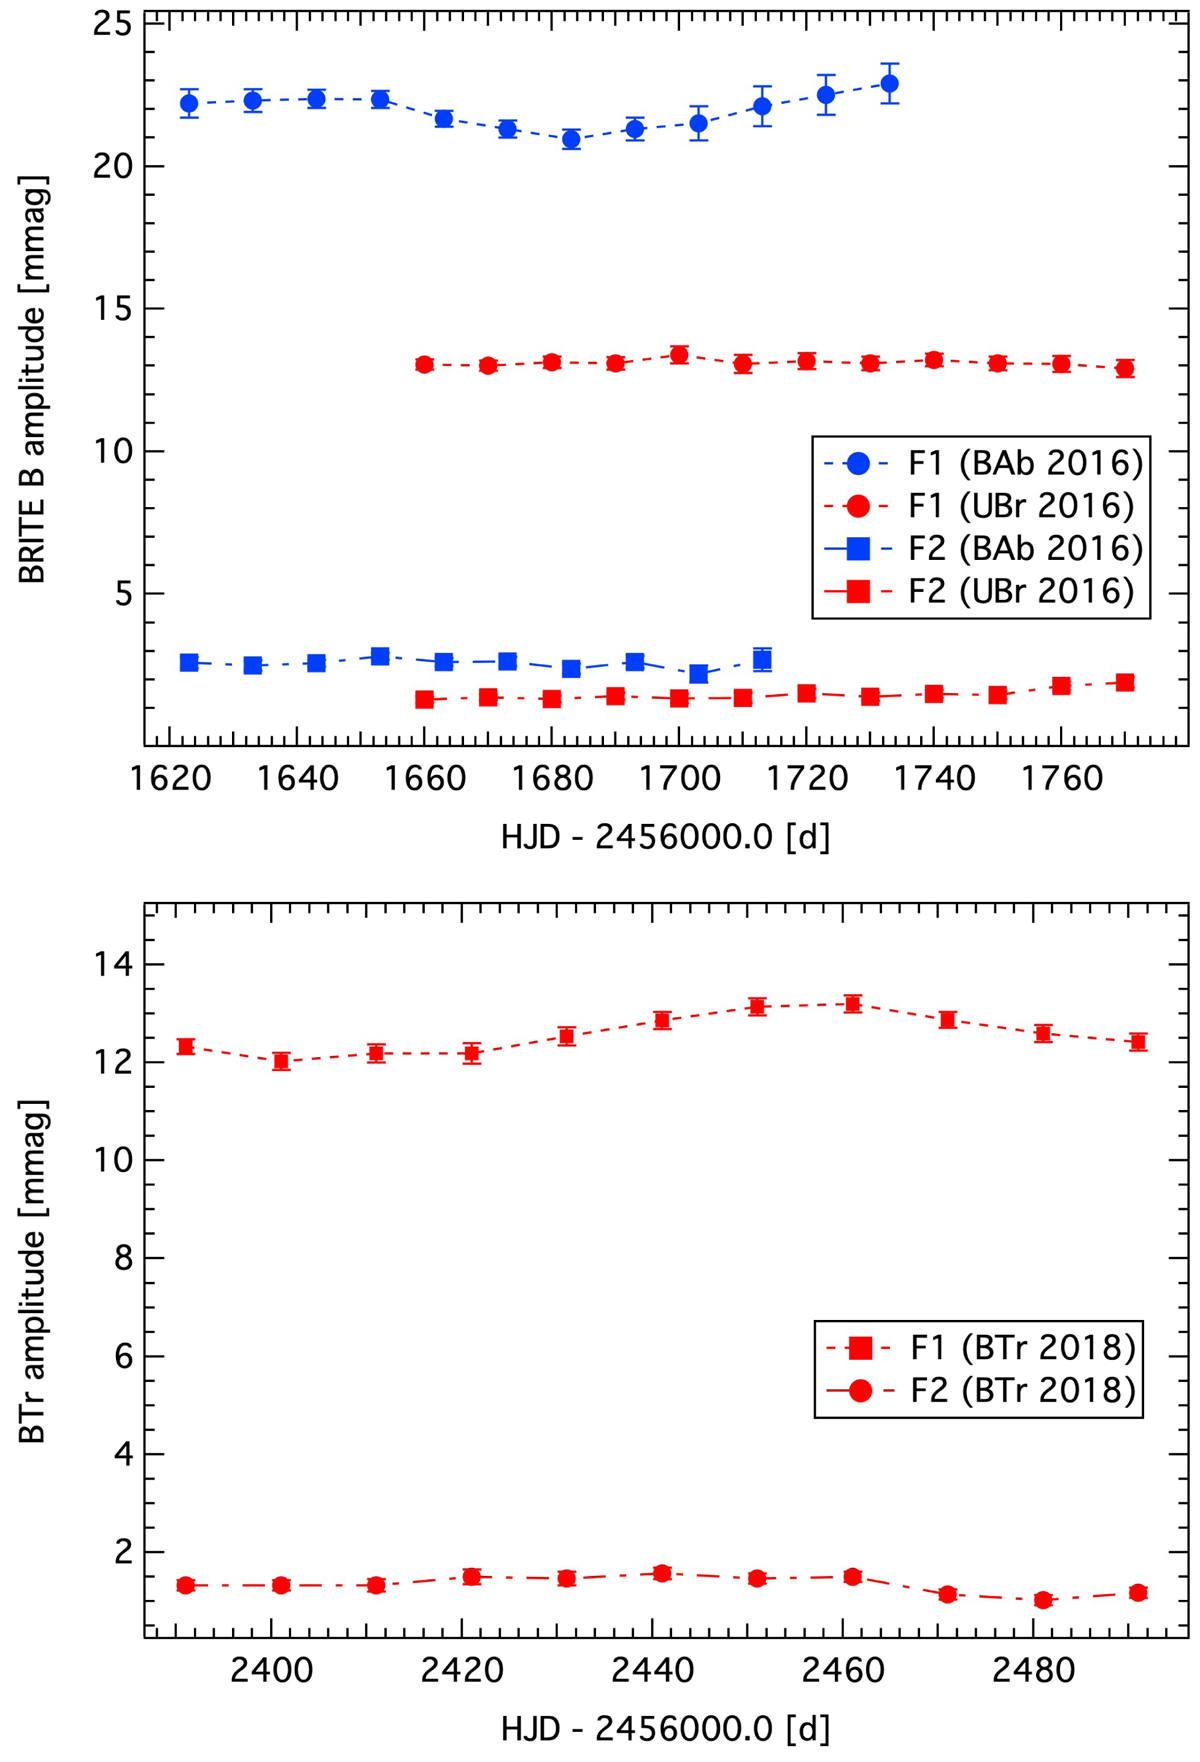
Seasonal amplitude behaviour of the two main pulsation frequencies, F1 (filled circles) and F2 (filled squares). Top panel: 30-day subsets with 20-day overlaps for the BAb 2016 (blue) and UBr 2016 (red) data (top panel); bottom panel: 30-day subsets with 20-day overlaps for the BTr 2018 data (red). The one-sigma error bars in the figure are often smaller than the symbol size.
Current usage metrics show cumulative count of Article Views (full-text article views including HTML views, PDF and ePub downloads, according to the available data) and Abstracts Views on Vision4Press platform.
Data correspond to usage on the plateform after 2015. The current usage metrics is available 48-96 hours after online publication and is updated daily on week days.
Initial download of the metrics may take a while.