Free Access
Fig. 12.
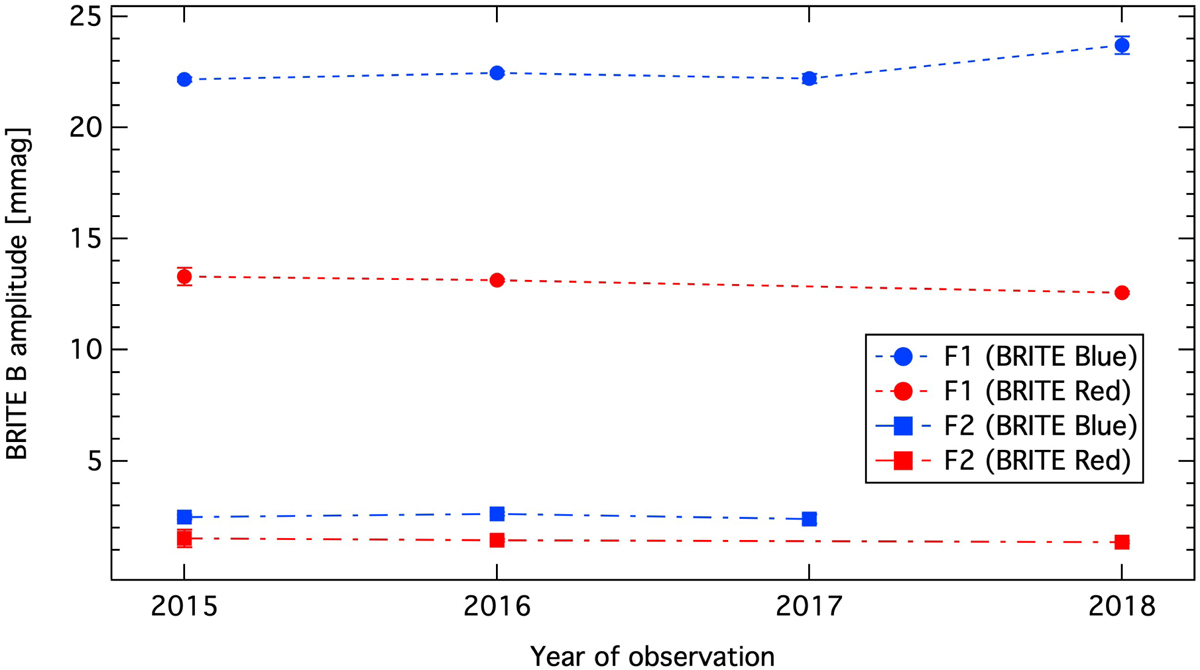
Annual behaviour of the amplitudes of the two main pulsation frequencies, F1 (filled circles), and F2 (filled squares) based on the BRITE-Constellation observations in the B (blue) and R (red) filter conducted every year from 2015 to early 2019. The one-sigma error bars in the figure are mostly smaller than the symbol size.
Current usage metrics show cumulative count of Article Views (full-text article views including HTML views, PDF and ePub downloads, according to the available data) and Abstracts Views on Vision4Press platform.
Data correspond to usage on the plateform after 2015. The current usage metrics is available 48-96 hours after online publication and is updated daily on week days.
Initial download of the metrics may take a while.