Fig. 10.
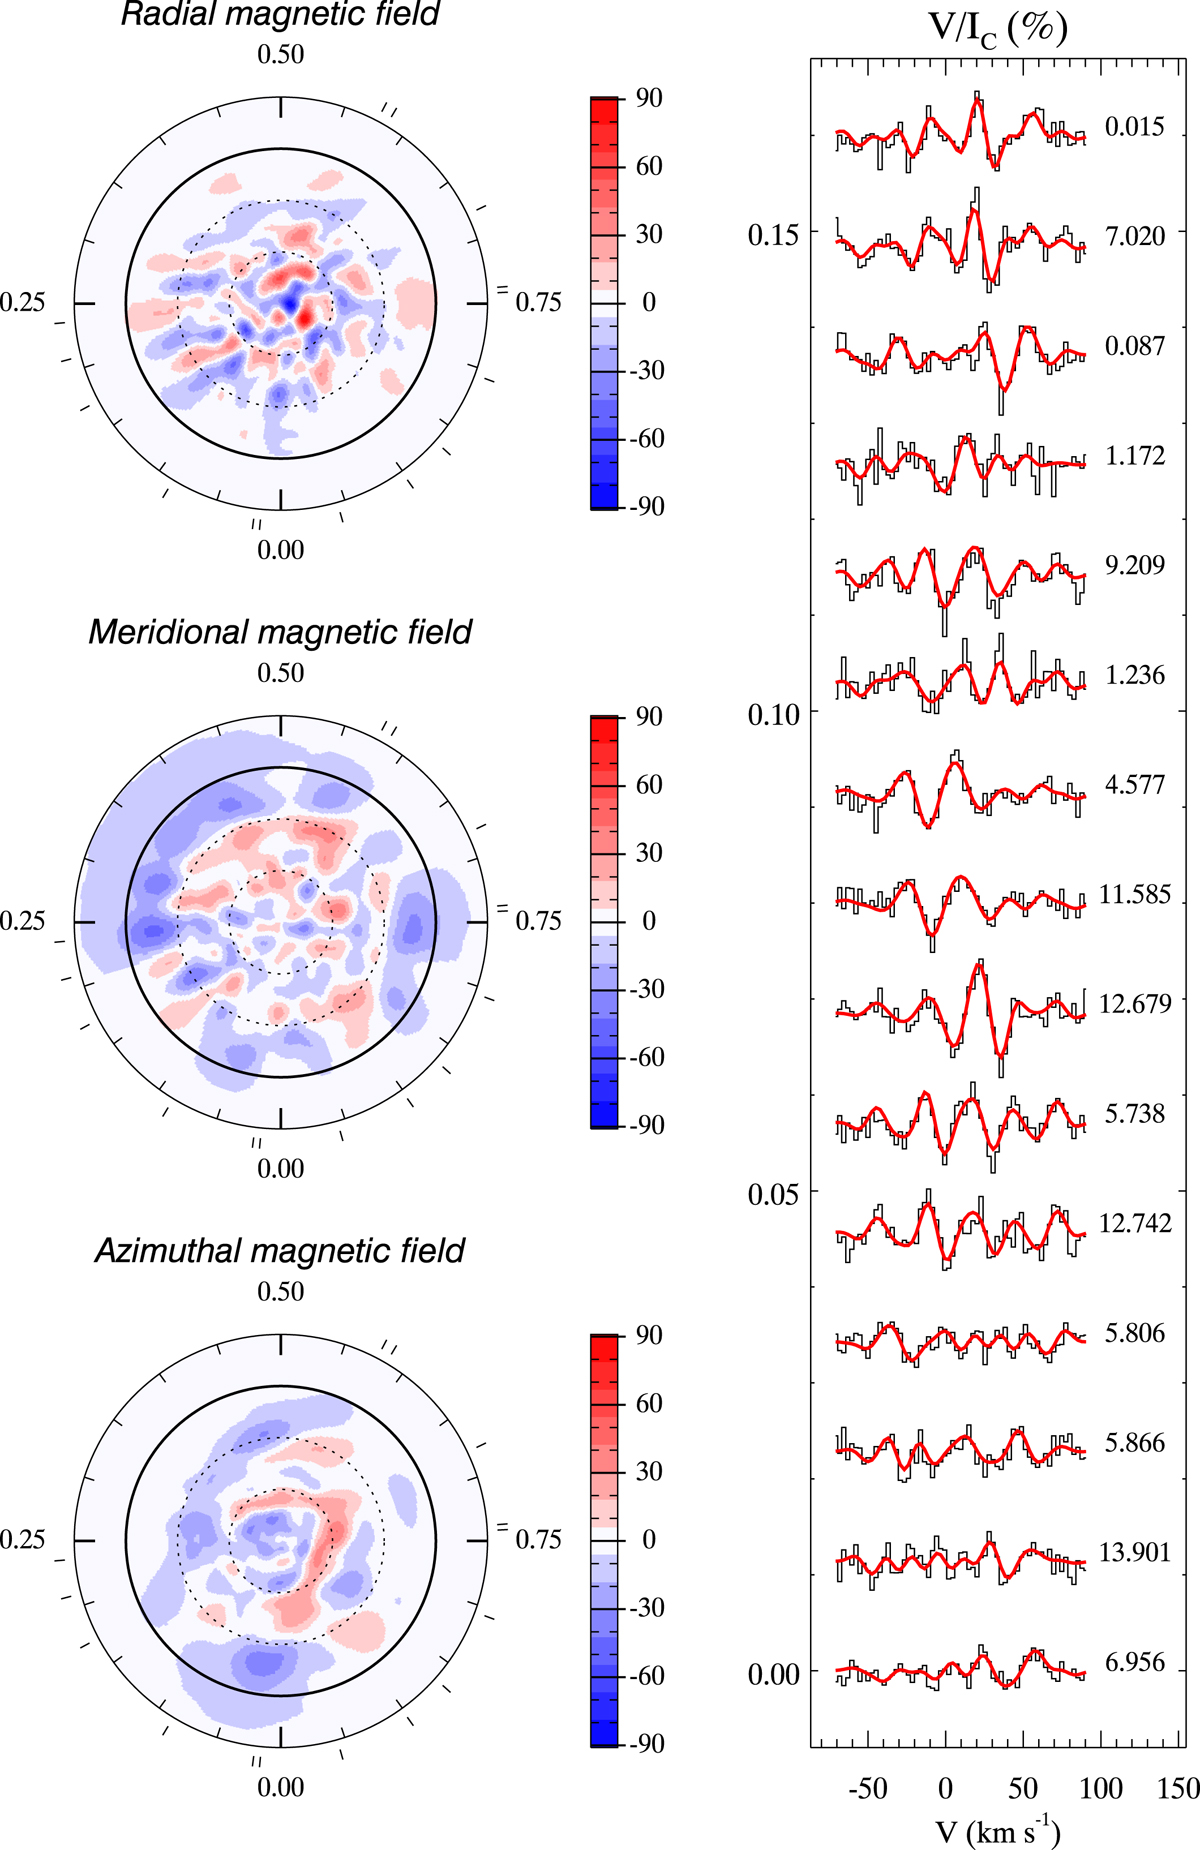
Magnetic field maps of β Cas and corresponding Stokes V profile fits obtained with ZDI for Prot = 0.868 d. The plots on the left side show the radial, meridional, and azimuthal magnetic field components in the flattened polar projection. The thick circle corresponds to the stellar equator. The numbers next to surface plots correspond to rotational phases while the short bars illustrate rotational phase coverage. The colour bars indicate the field strength in Gauss. The right panel shows the observed (histogram) and model (solid red curves) profiles, shifted vertically with an equidistant step. The rotational phases (calculated relative to HJD0 = 2457358.31370) are indicated to the right of each line profile.
Current usage metrics show cumulative count of Article Views (full-text article views including HTML views, PDF and ePub downloads, according to the available data) and Abstracts Views on Vision4Press platform.
Data correspond to usage on the plateform after 2015. The current usage metrics is available 48-96 hours after online publication and is updated daily on week days.
Initial download of the metrics may take a while.