Fig. 1.
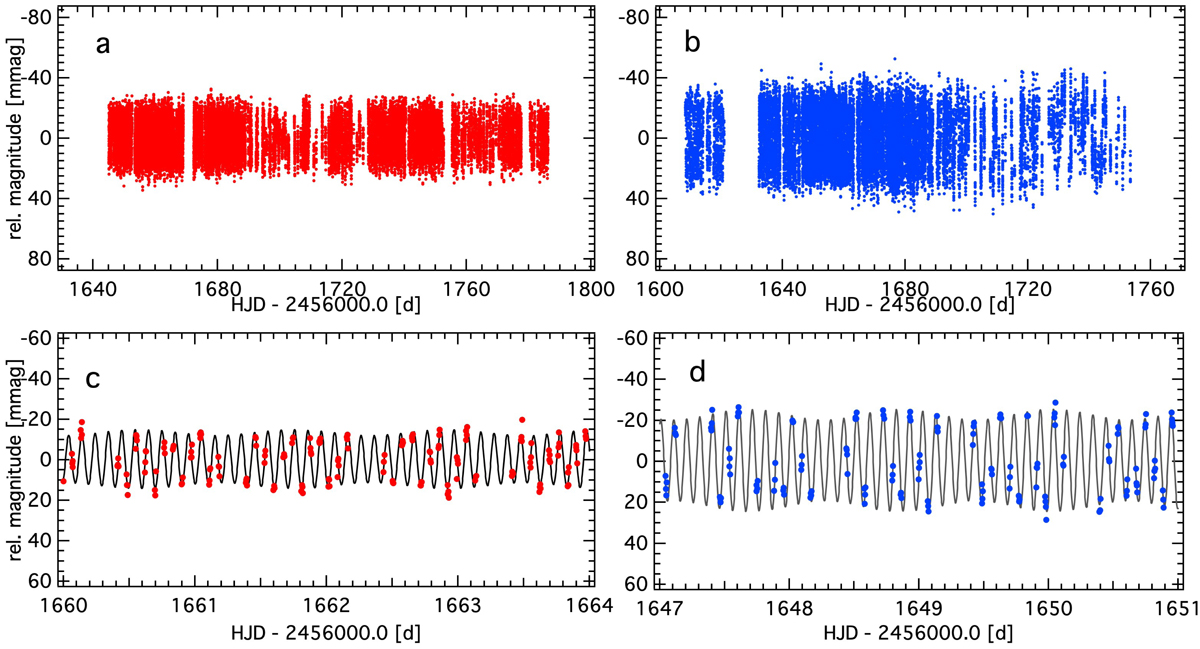
BRITE photometric time series obtained by UBr (panel a) and BAb in 2016 (panel b) to the same Y-axis scale and with a time base of 170 days on both X axes. Panels c and d: four-day subsets of the UBr and BAb 2016 light curves binned to five-minute intervals and the corresponding multi-sine fit with the two identified pulsation frequencies again to the same Y-axis scale and with a time base of four days on both X axes.
Current usage metrics show cumulative count of Article Views (full-text article views including HTML views, PDF and ePub downloads, according to the available data) and Abstracts Views on Vision4Press platform.
Data correspond to usage on the plateform after 2015. The current usage metrics is available 48-96 hours after online publication and is updated daily on week days.
Initial download of the metrics may take a while.