Table 2
Overview of best-fitting orbit solutions.
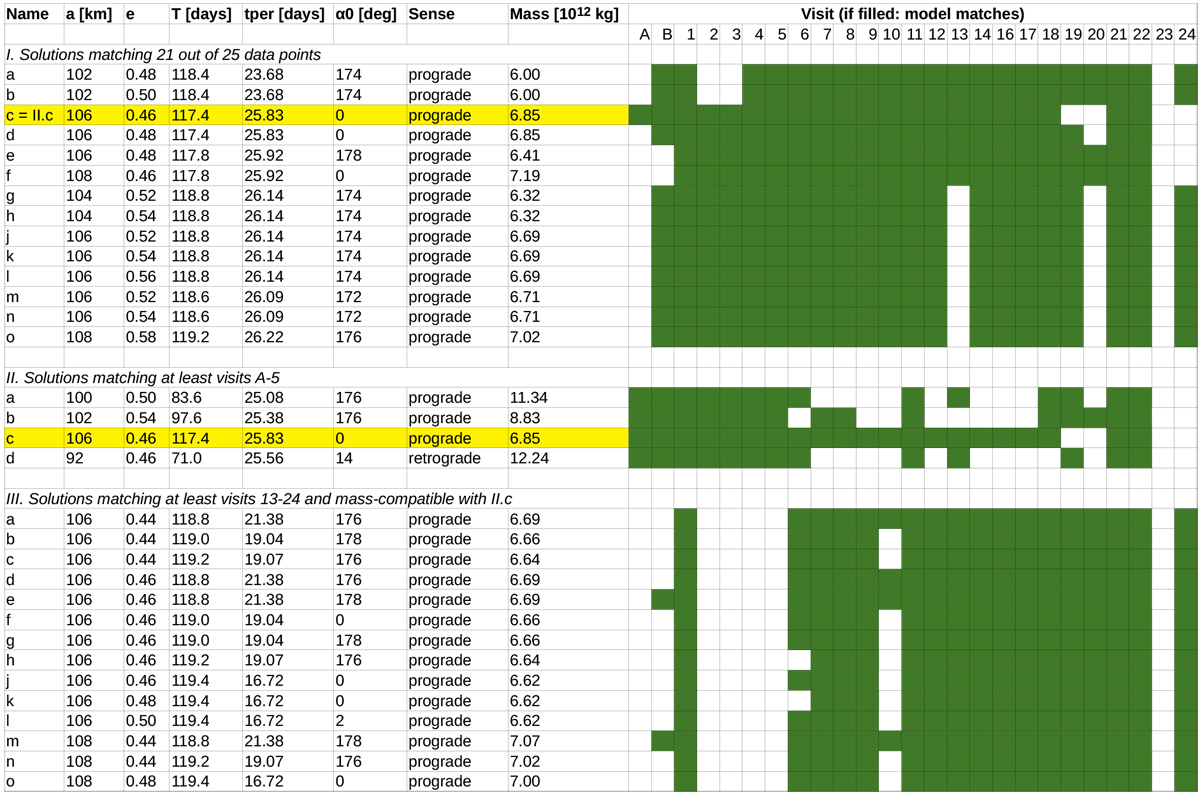
Notes. The solutions are listed in three blocks (I to III) as discussed in the text. The first column identifies the orbits with letters to facilitate the discussion in the text. Columns 2–8 list the orbit’s Keplerian elements (semi-major axis, a, eccentricity, e, mutual orbital period, T, time of perihelion relative to UT 2016 August 22, tper, and the angle between the line of sight on UT 2016 August 22 and the line of apsides, α0), the sense of rotation and the system mass given by Kepler’s third law MS = (4π2a3)∕(GT2). The following 24 columns show whether an orbit solution reproduces the measured distance within its error bars during the concerned epoch regardless of its sign (green if true). Marked in yellow is the solution (II.c) that we adopt as the best fit to our data (Fig. 5), because it best reproduces the pre-perihelion data and indeed all datasets from 2011 to mid-2018. It is also the only solution with a mass-compatible equivalent matching all data from the inactive phase (block III and refined parameter grid in Fig. 4).
Current usage metrics show cumulative count of Article Views (full-text article views including HTML views, PDF and ePub downloads, according to the available data) and Abstracts Views on Vision4Press platform.
Data correspond to usage on the plateform after 2015. The current usage metrics is available 48-96 hours after online publication and is updated daily on week days.
Initial download of the metrics may take a while.