Open Access
Fig. A.2
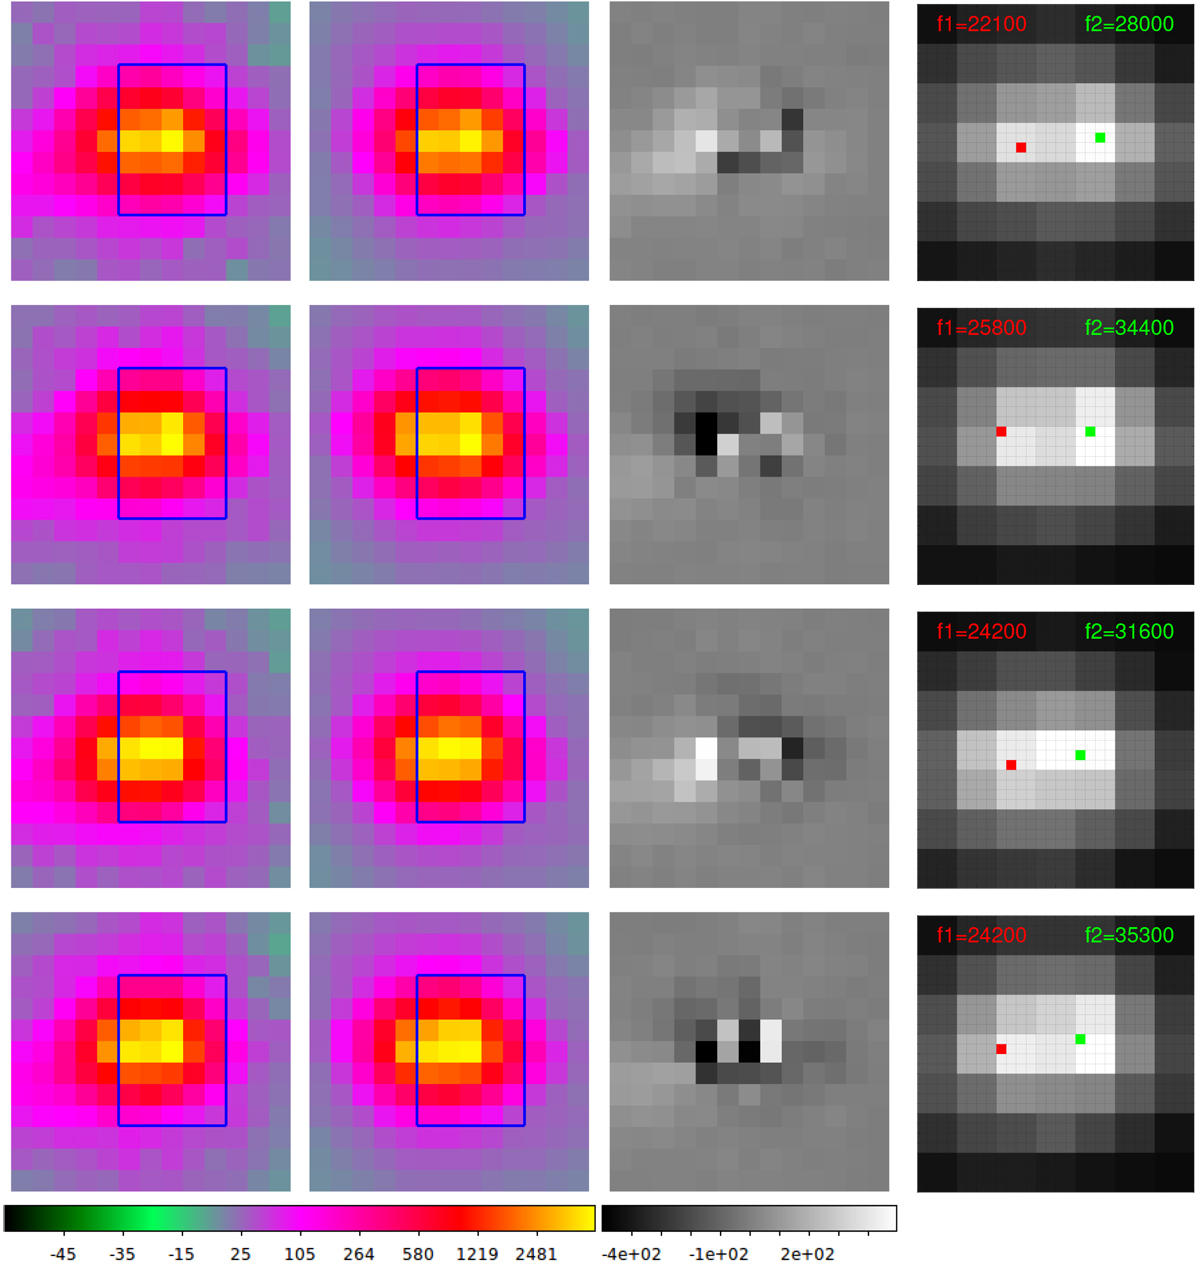
Visit 1, dither stations 1–4 from top to bottom. Brightness scale factor b = 50. The blue fitting region was reduced in size towards the tail-side to avoid fitting the tail instead of the nucleus. Otherwise same as Fig. A.1.
Current usage metrics show cumulative count of Article Views (full-text article views including HTML views, PDF and ePub downloads, according to the available data) and Abstracts Views on Vision4Press platform.
Data correspond to usage on the plateform after 2015. The current usage metrics is available 48-96 hours after online publication and is updated daily on week days.
Initial download of the metrics may take a while.