Fig. A.1
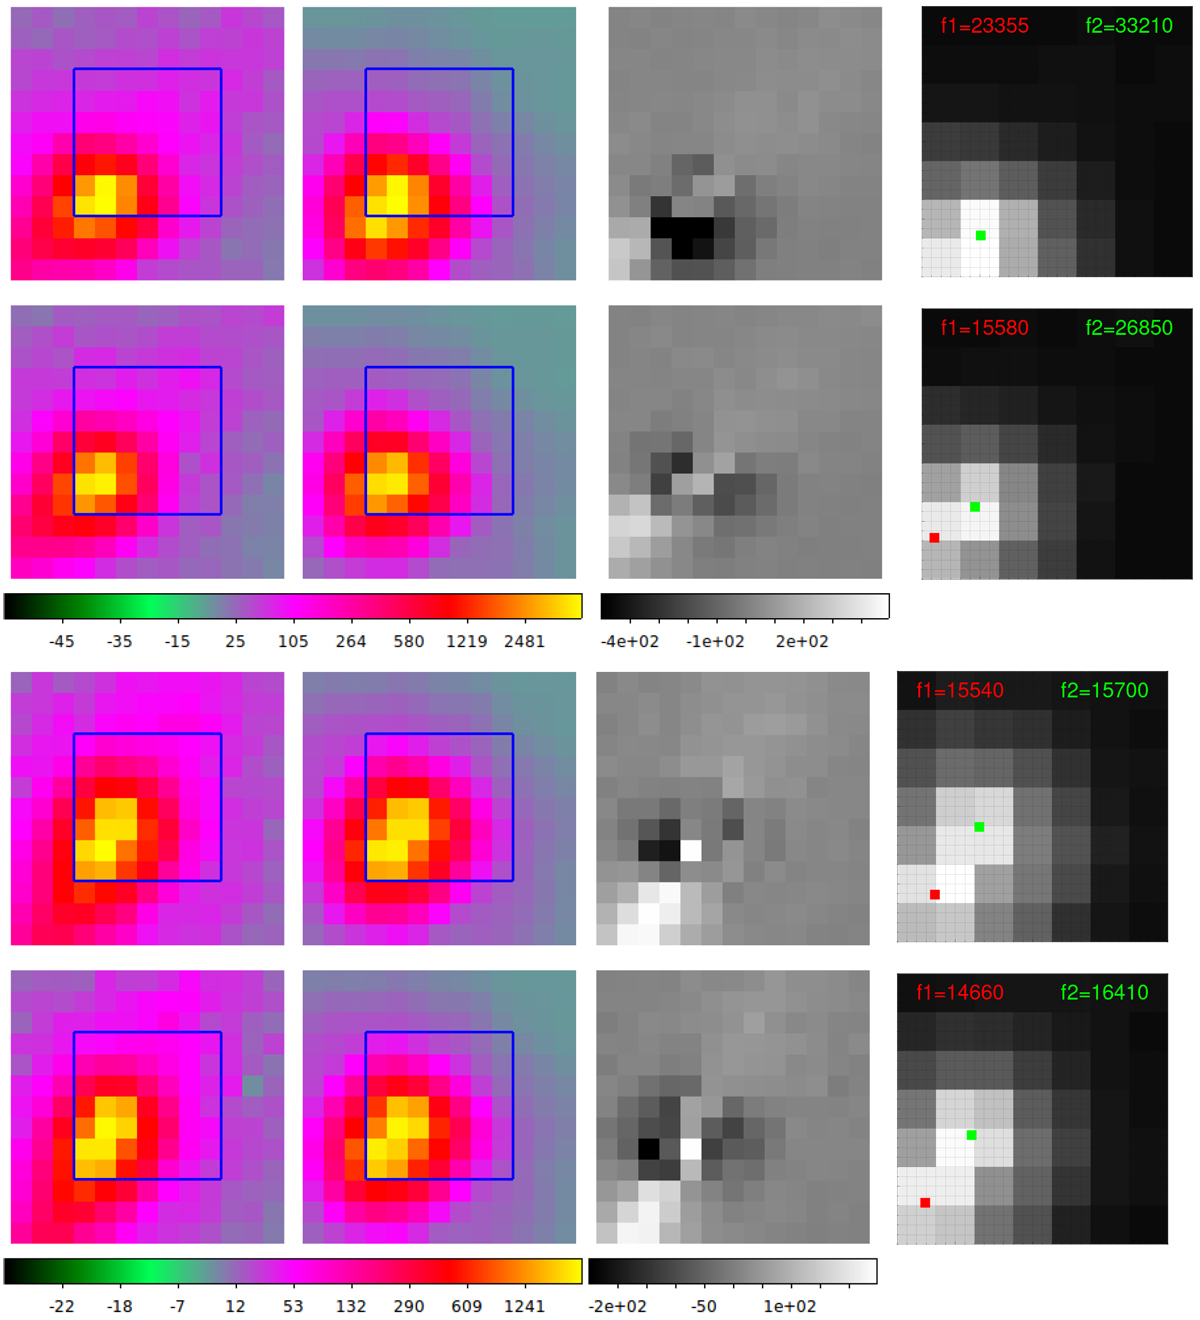
Visits A (upper two rows, brightness scale factor b = 50) and B (lowertwo rows, bightness scale factor b = 25), dither stations 1–2 from top to bottom, respectively. Left: observation (minimum stack of two images obtained at the same dither station, logarithmic brightness scale with range [-b, 100b]). The blue line marks the area that was included in calculating the sum of squared differences S. This area is off-centred in the direction opposite to the tail in order to avoid fitting the tailas best possible. Center left: best fitting model at the same brightness scale. Center right: difference between observation and model at a linear brightness scale, range [-10b, 10b]. Right: central seven pixels of observation with the sub-pixel positions of the two components marked. The brighter component is marked green, the fainter component is red. The brightness scale is linear in the range [-10, 100b]. The quantities f1 and f2 are the total counts from the two components in the simulation.
Current usage metrics show cumulative count of Article Views (full-text article views including HTML views, PDF and ePub downloads, according to the available data) and Abstracts Views on Vision4Press platform.
Data correspond to usage on the plateform after 2015. The current usage metrics is available 48-96 hours after online publication and is updated daily on week days.
Initial download of the metrics may take a while.