Fig. 5
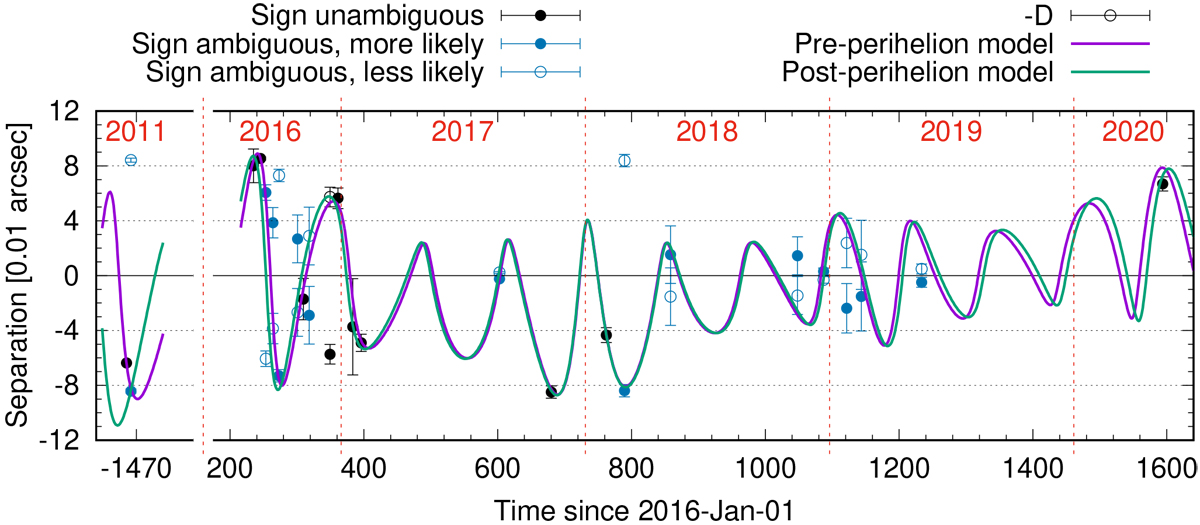
Measured distances including their sign and possible orbit fits. The violet curve shows a representative orbit solution that was required to at least reproduce visits A–5 (a = 106.5 km, e = 0.46, tp = 25.83 d, T = 117.4 d, α0 = 0.0°, MS = 6.94 × 10¹² kg). The green curve shows a representative solution that was required to reproduce visits 13–22 and 24 (a = 107.5 km, e = 0.46, tp = 19.00 d, T = 119.0 d, α0 = 0.0°, MS = 6.95 × 10¹² kg). The perihelion passage took place between visits 7 and 8 on DOY=314.
Current usage metrics show cumulative count of Article Views (full-text article views including HTML views, PDF and ePub downloads, according to the available data) and Abstracts Views on Vision4Press platform.
Data correspond to usage on the plateform after 2015. The current usage metrics is available 48-96 hours after online publication and is updated daily on week days.
Initial download of the metrics may take a while.