Fig. 2
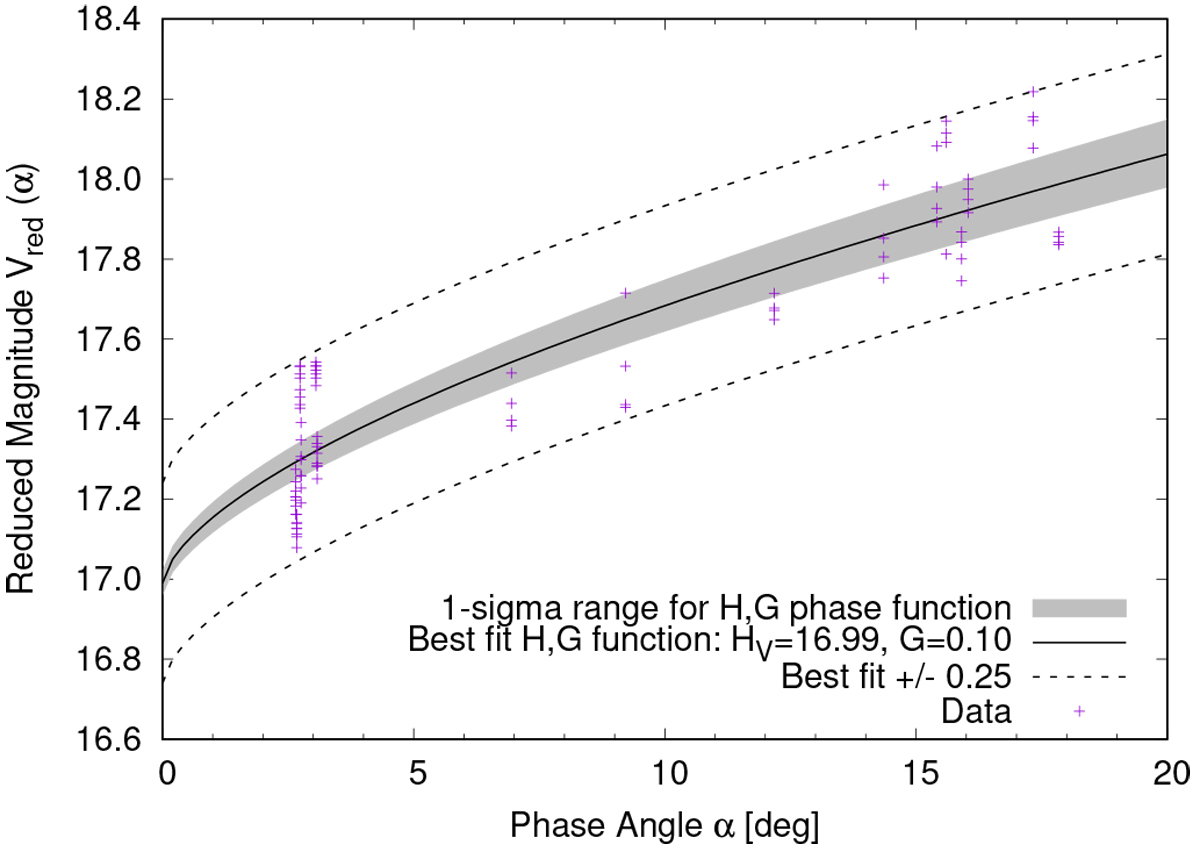
Phase function of the combined, inactive 288P system. The data points are from PSF-fitting of two point sources to individual exposures for visit 24 (α ~ 3°), and from fitting minimum-stacked pairs as described in Sect. 3.1 for visits 13–23. The scatter of the data reflects the rotation-induced variability of the system’s brightness. The solid line shows the best-fit H− G phase function with HV = (16.99 ± 0.03) and G = (0.10 ± 0.04). The shaded area reflects the 1σ uncertainty of the fit, and the dashed lines indicate the interval ΔVred = ±0.25 covered by the rotational lightcurve.
Current usage metrics show cumulative count of Article Views (full-text article views including HTML views, PDF and ePub downloads, according to the available data) and Abstracts Views on Vision4Press platform.
Data correspond to usage on the plateform after 2015. The current usage metrics is available 48-96 hours after online publication and is updated daily on week days.
Initial download of the metrics may take a while.