Fig. 7
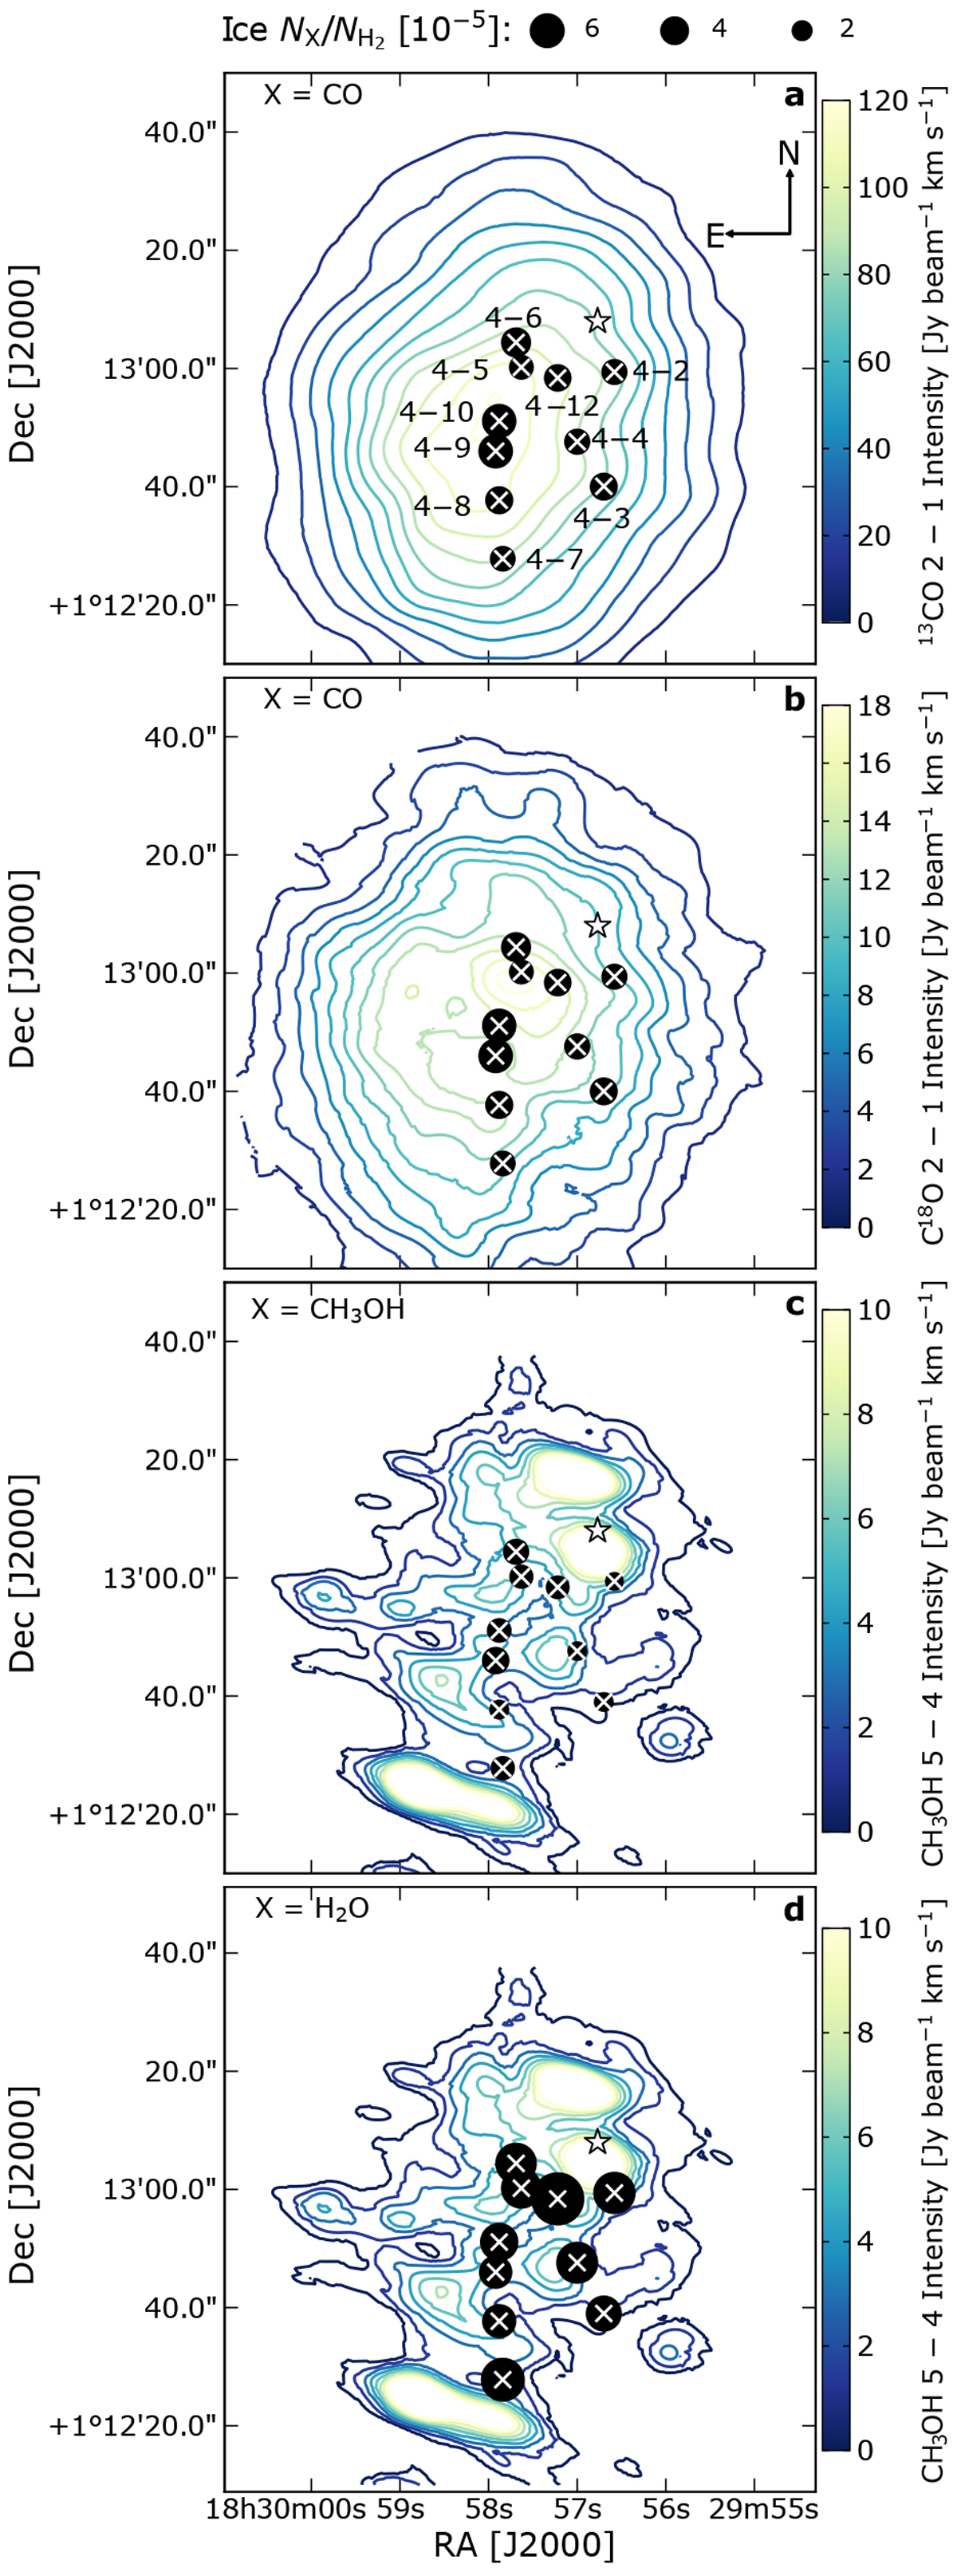
Gas-ice maps of the SVS 4 cluster. Ice abundances are shown as black circles. The contours at 3σ, 6σ, 9σ, etc. represent the gas-phase integrated intensities. a: CO abundances on gas 13CO 2–1; b: CO abundances on gas C18O 2–1; c: CH3 OH abundances on gas CH3OH 50−40 A+. d: H2O abundances on gas CH3OH 50−40 A+. The white crosses mark the position of the SVS 4 sources, and the white star represents SMM 4.
Current usage metrics show cumulative count of Article Views (full-text article views including HTML views, PDF and ePub downloads, according to the available data) and Abstracts Views on Vision4Press platform.
Data correspond to usage on the plateform after 2015. The current usage metrics is available 48-96 hours after online publication and is updated daily on week days.
Initial download of the metrics may take a while.