Free Access
Fig. 5
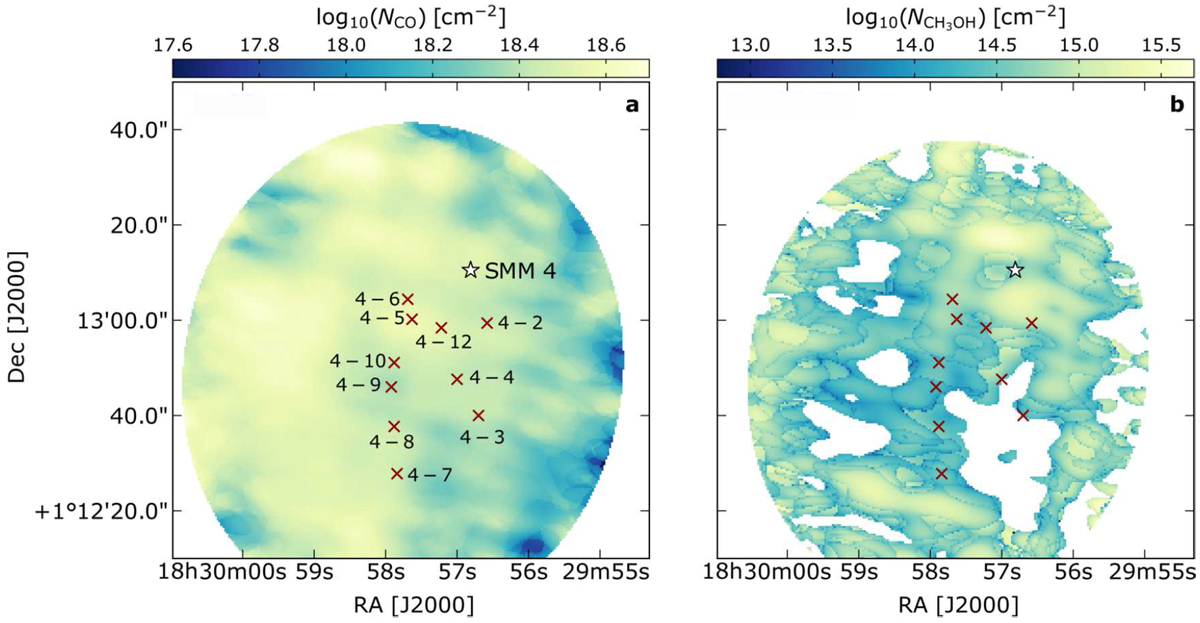
Gas column density maps of the SVS 4 cluster. a: 12CO column density map. b: CH3OH column density map. The white spaces within the area covered by SMA+APEX are regions where the strength of the emission drops below 5σ. The red crosses mark the position of the SVS 4 sources, and the white star represents SMM 4.
Current usage metrics show cumulative count of Article Views (full-text article views including HTML views, PDF and ePub downloads, according to the available data) and Abstracts Views on Vision4Press platform.
Data correspond to usage on the plateform after 2015. The current usage metrics is available 48-96 hours after online publication and is updated daily on week days.
Initial download of the metrics may take a while.