Fig. 4
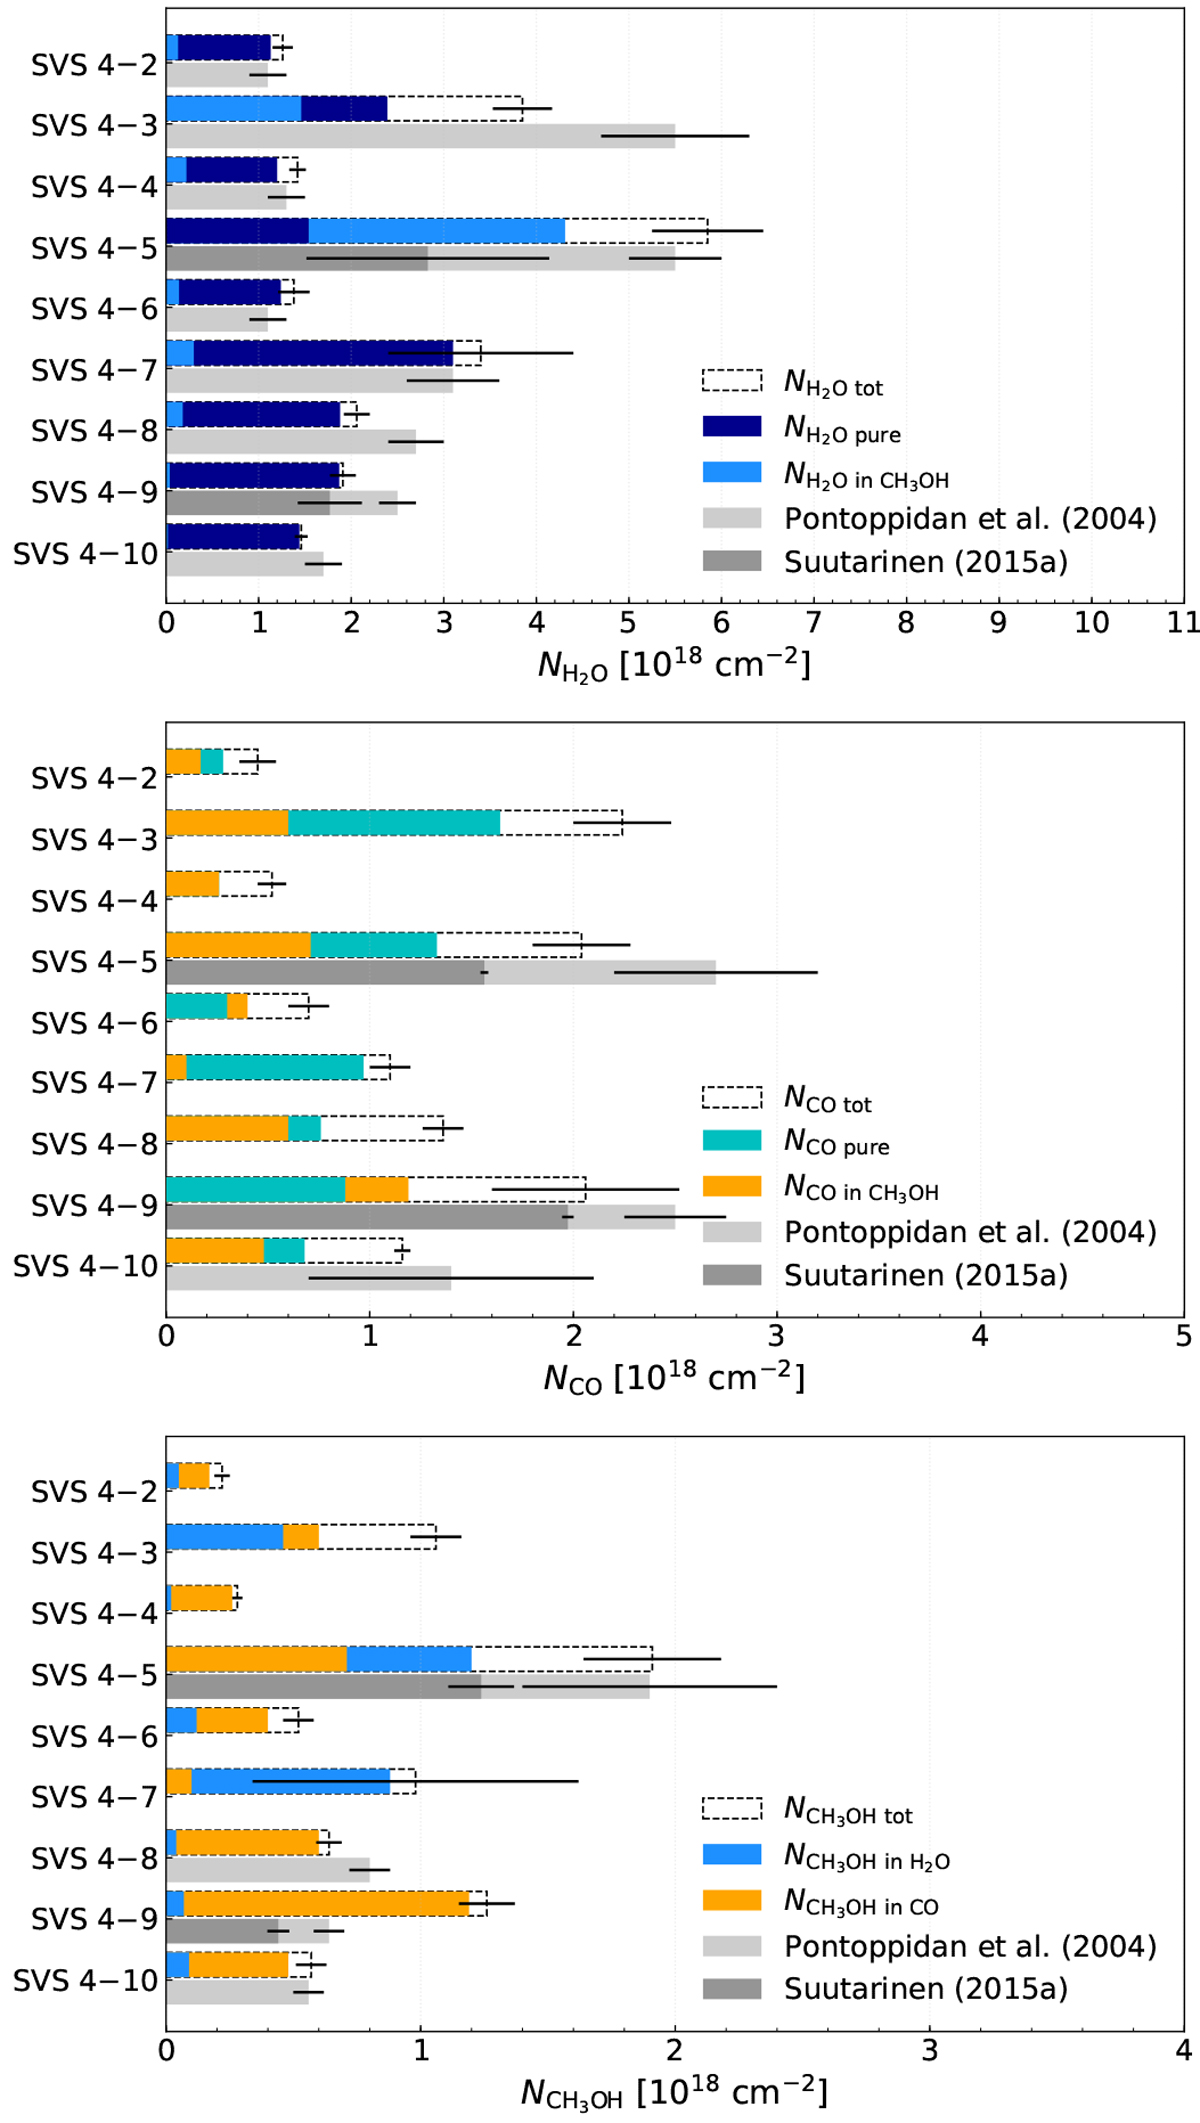
H2O (top), CO (middle), and CH3OH (bottom) ice column densities obtained in this study compared to Pontoppidan et al. (2004) (light grey) and Suutarinen (2015a) (dark grey). The CO column density towards SVS 4−10 is from Chiar et al. (1994). The coloured bars represent the ice column densities of the pure species or of the species in a mixture, and the dashed bars depict the total ice column densities obtained by summing the ice column densities of the pure species and of the species in a mixture.
Current usage metrics show cumulative count of Article Views (full-text article views including HTML views, PDF and ePub downloads, according to the available data) and Abstracts Views on Vision4Press platform.
Data correspond to usage on the plateform after 2015. The current usage metrics is available 48-96 hours after online publication and is updated daily on week days.
Initial download of the metrics may take a while.