Fig. B.2
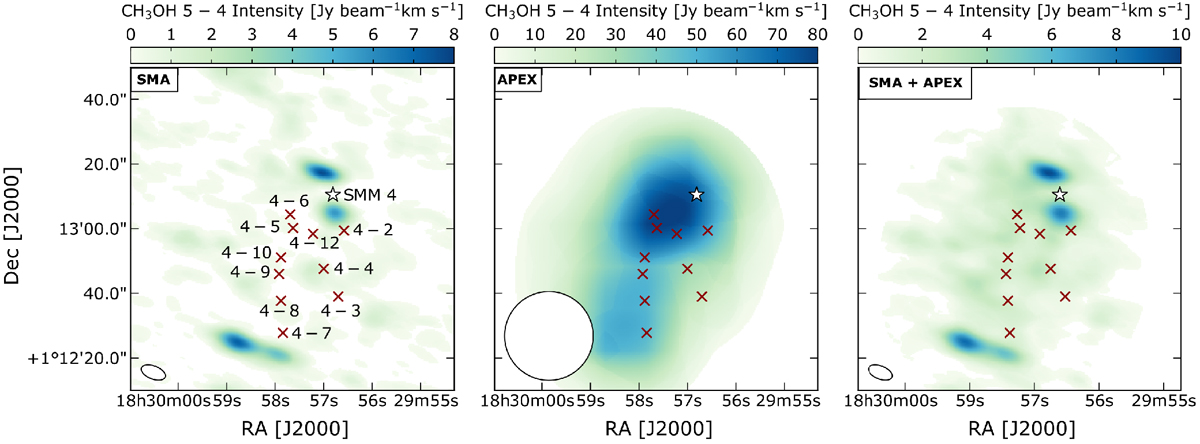
Left: CH3OH 50 − 40 A+ line emissionobserved by the SMA. Middle: CH3OH 50 − 40 A+ line emissiondetected by the APEX telescope. Right: CH3OH 50 − 40 A+ line emission resulting from the SMA + APEX combination. All lines are integrated between 5 and 13 km s−1. Contours are at 3σ, 6σ, 9σ, etc. The synthesised beam is shown in white in the bottom left corner of each panel. The dark red crosses and the white star illustrate the positions of the SVS 4 stars and of SMM 4, respectively.
Current usage metrics show cumulative count of Article Views (full-text article views including HTML views, PDF and ePub downloads, according to the available data) and Abstracts Views on Vision4Press platform.
Data correspond to usage on the plateform after 2015. The current usage metrics is available 48-96 hours after online publication and is updated daily on week days.
Initial download of the metrics may take a while.