Free Access
Fig. B.1
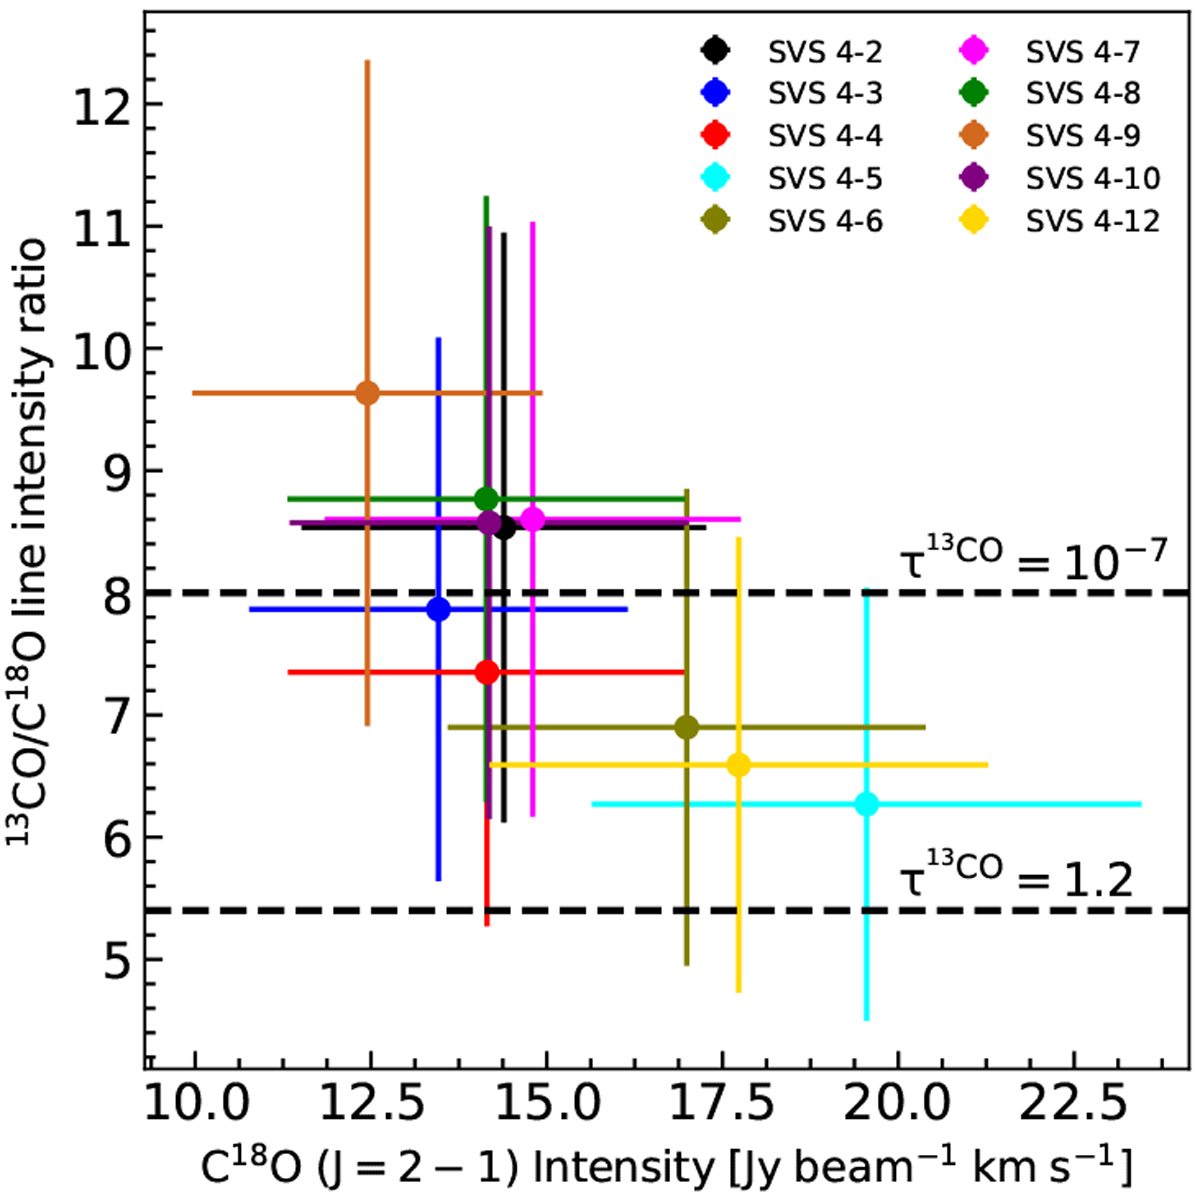
I(13CO)/I(C18O) line intensityratio vs. the I(C18O) line intensity. The dashed lines indicate two optical depth regimes for 13CO; the sources are represented by coloured dots. The error bars assume a 20% error from the flux calibration.
Current usage metrics show cumulative count of Article Views (full-text article views including HTML views, PDF and ePub downloads, according to the available data) and Abstracts Views on Vision4Press platform.
Data correspond to usage on the plateform after 2015. The current usage metrics is available 48-96 hours after online publication and is updated daily on week days.
Initial download of the metrics may take a while.