Fig. A.1
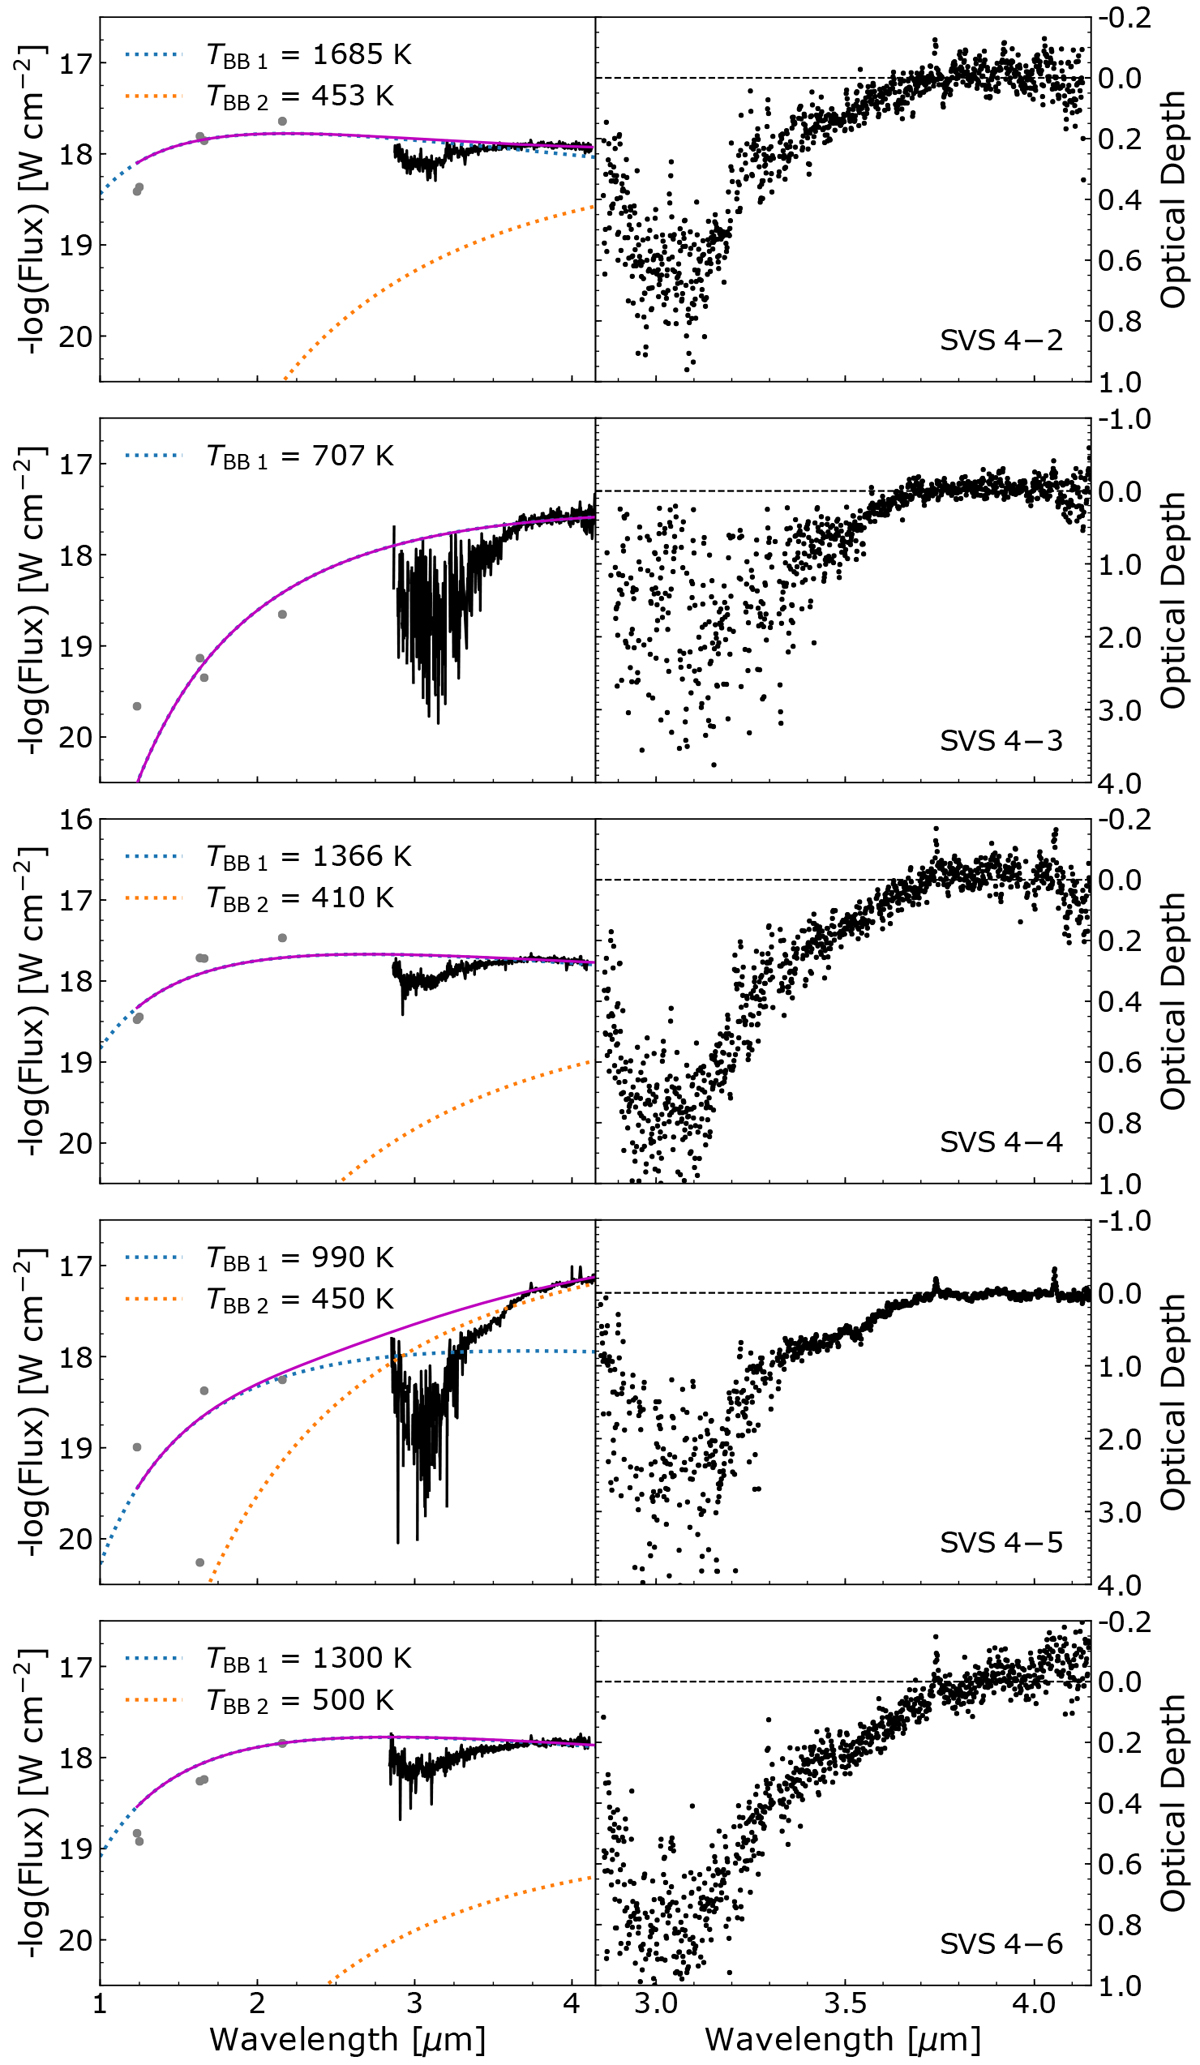
L-band SED and optical depth of the sources towards the SVS 4 cluster. Left: the dotted blue and orange lines show the blackbody functions we used to determine the continuum (magenta line) by fitting the dark grey photometric points. The temperature of each blackbody component is shown in the upper left corner of each panel and is given in K. Right: L-band observations towards the SVS 4 sources on an optical depth scale. The dashed black lines are used as a reference for τ = 0.
Current usage metrics show cumulative count of Article Views (full-text article views including HTML views, PDF and ePub downloads, according to the available data) and Abstracts Views on Vision4Press platform.
Data correspond to usage on the plateform after 2015. The current usage metrics is available 48-96 hours after online publication and is updated daily on week days.
Initial download of the metrics may take a while.