Fig. 5
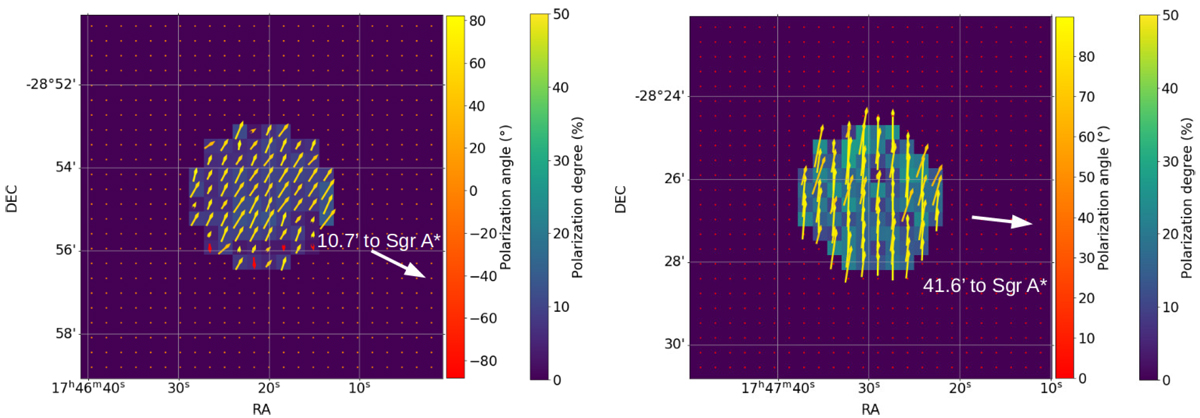
Simulated IXPE polarization maps of G0.11-0.11 (left panel) and Sgr B2 (right panel). The background is color-scaled according to the polarization degree. The colored arrows represent the direction of the polarization angle and are color-scaled accordingly. The color scales for the polarization degree and angle are shown at the right of each figure. The direction of Sgr A* is also indicated for comparison.
Current usage metrics show cumulative count of Article Views (full-text article views including HTML views, PDF and ePub downloads, according to the available data) and Abstracts Views on Vision4Press platform.
Data correspond to usage on the plateform after 2015. The current usage metrics is available 48-96 hours after online publication and is updated daily on week days.
Initial download of the metrics may take a while.