Fig. 3
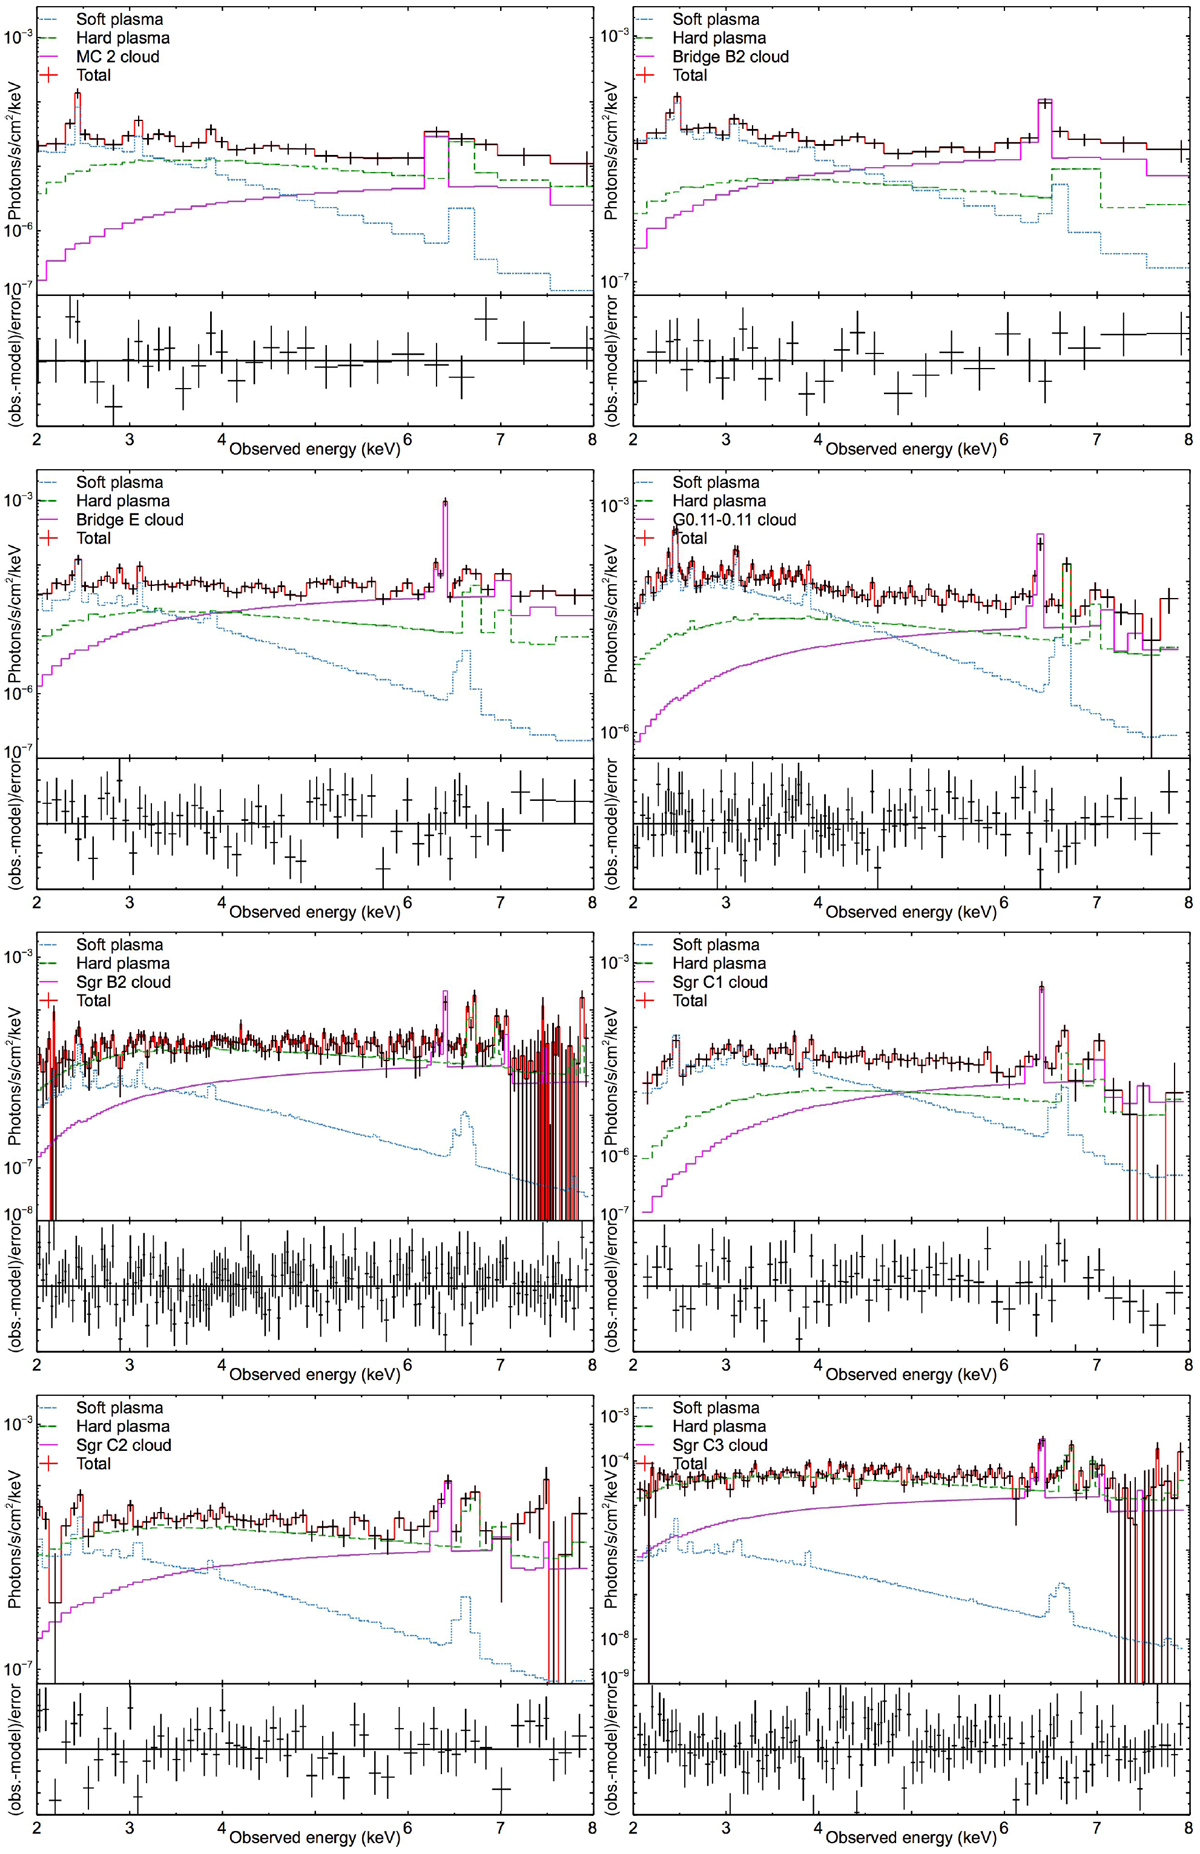
From top to bottom: unfolded spectra and residuals to the best-fit model for MC2, Bridge B2, Bridge E, G0.11-0.11, Sgr B2, Sgr C1, Sgr C2, and Sgr C3. The total best-fit model and the reflection component are displayed as a solid line. The spectrum of the hard plasma is displayed as a dashed line. The spectrum of the soft plasma is displayed as a dotted line.
Current usage metrics show cumulative count of Article Views (full-text article views including HTML views, PDF and ePub downloads, according to the available data) and Abstracts Views on Vision4Press platform.
Data correspond to usage on the plateform after 2015. The current usage metrics is available 48-96 hours after online publication and is updated daily on week days.
Initial download of the metrics may take a while.