Fig. 2
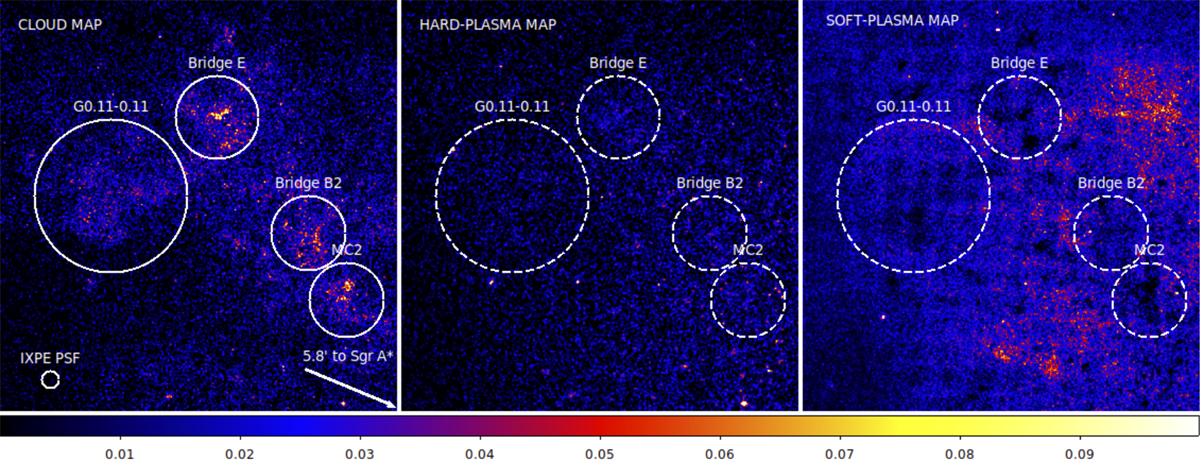
From left to right: background- and continuum-subtracted Chandra maps of the cloud, hard plasma, and soft plasma component in the Sgr A region. Images are smoothed using a 3-pixel Gaussian kernel. The color bar displayed at the bottom has adimensional units because the images are normalized to the maximum value. The regions comprising the targets selected for IXPE simulations (i.e., MC2, Bridge-B2, Bridge-E, and G0.11-0.11) are shown. In the first panel, a circle withthe size of the IXPE PSF is shown for comparison. The direction of Sgr A* is indicated with an arrow.
Current usage metrics show cumulative count of Article Views (full-text article views including HTML views, PDF and ePub downloads, according to the available data) and Abstracts Views on Vision4Press platform.
Data correspond to usage on the plateform after 2015. The current usage metrics is available 48-96 hours after online publication and is updated daily on week days.
Initial download of the metrics may take a while.