Free Access
Fig. 10.
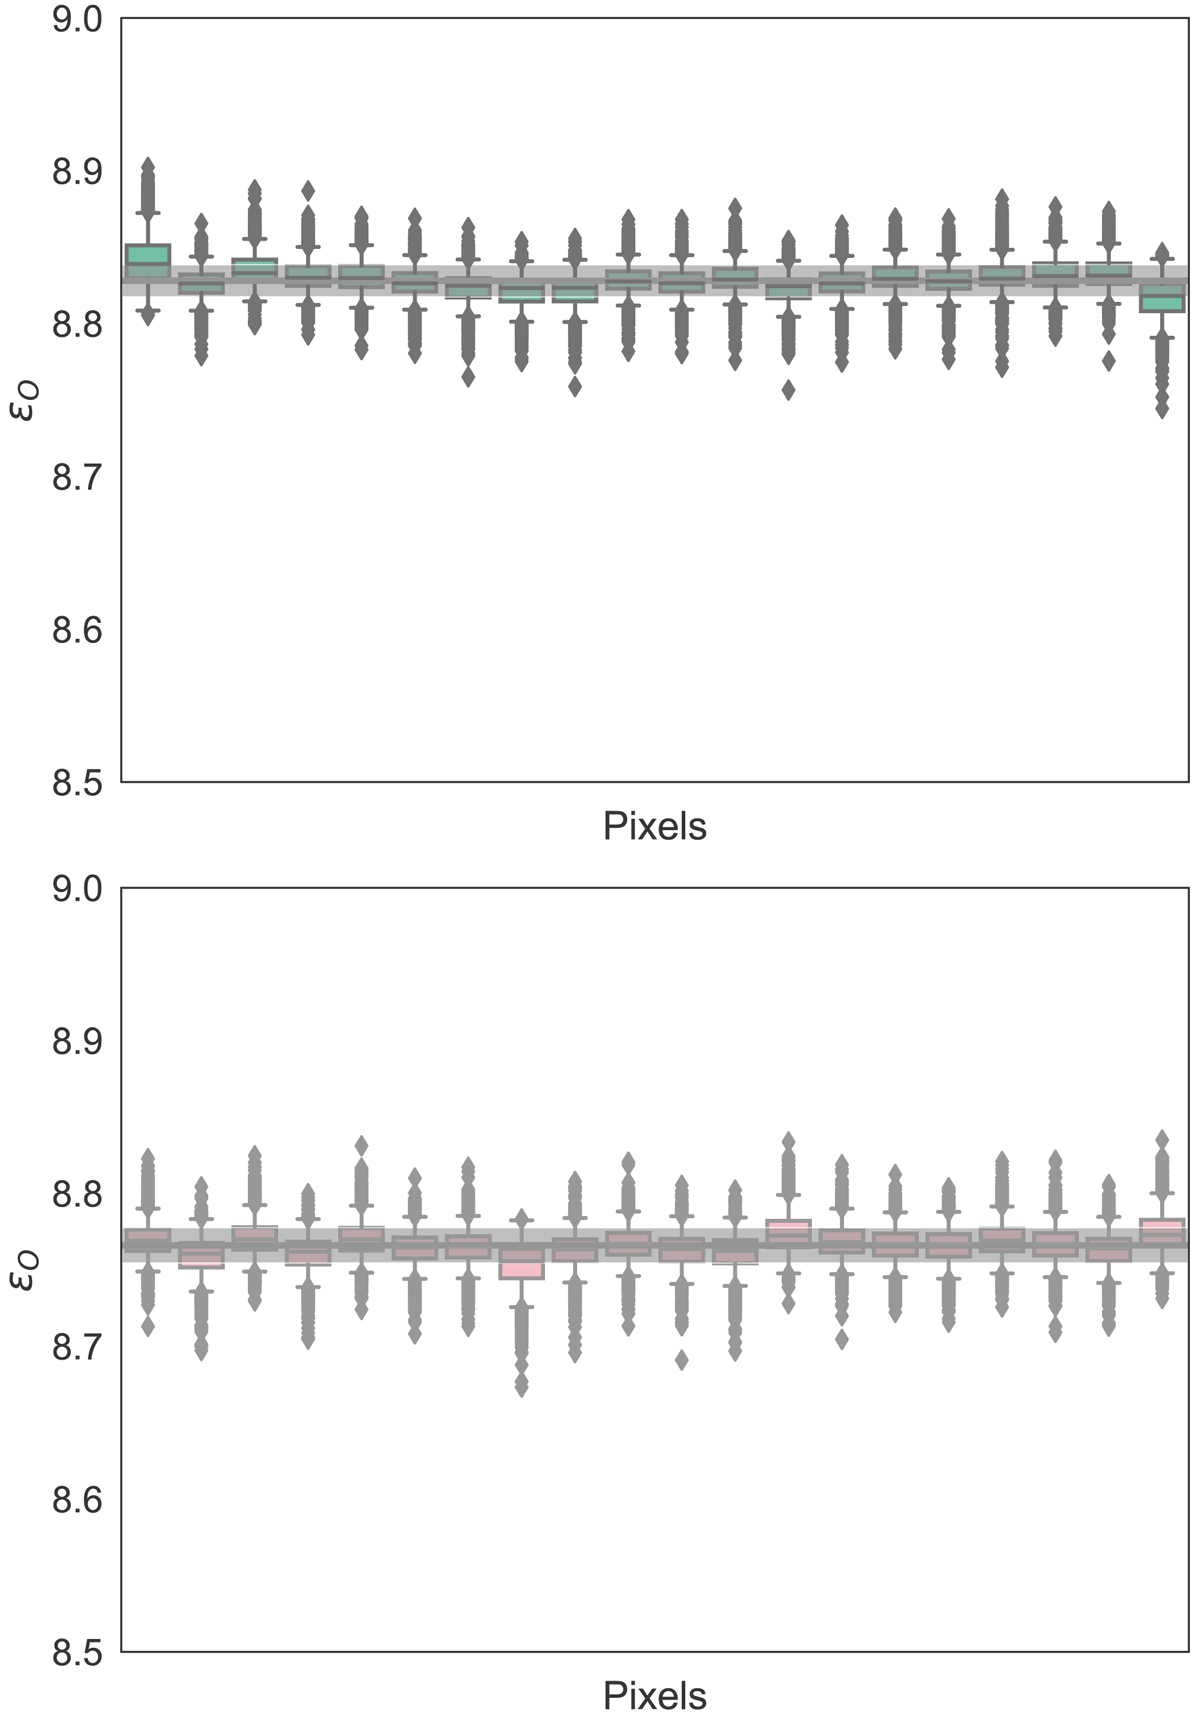
Distribution of oxygen abundance for each pixel. The gray horizontal line represents the hyperparameter of oxygen abundance and the gray area covers the probable values within the standard deviation, which is the other hyperparameter. Granules are shown in the upper panel and lanes in the bottom panel.
Current usage metrics show cumulative count of Article Views (full-text article views including HTML views, PDF and ePub downloads, according to the available data) and Abstracts Views on Vision4Press platform.
Data correspond to usage on the plateform after 2015. The current usage metrics is available 48-96 hours after online publication and is updated daily on week days.
Initial download of the metrics may take a while.