Free Access
Fig. 2
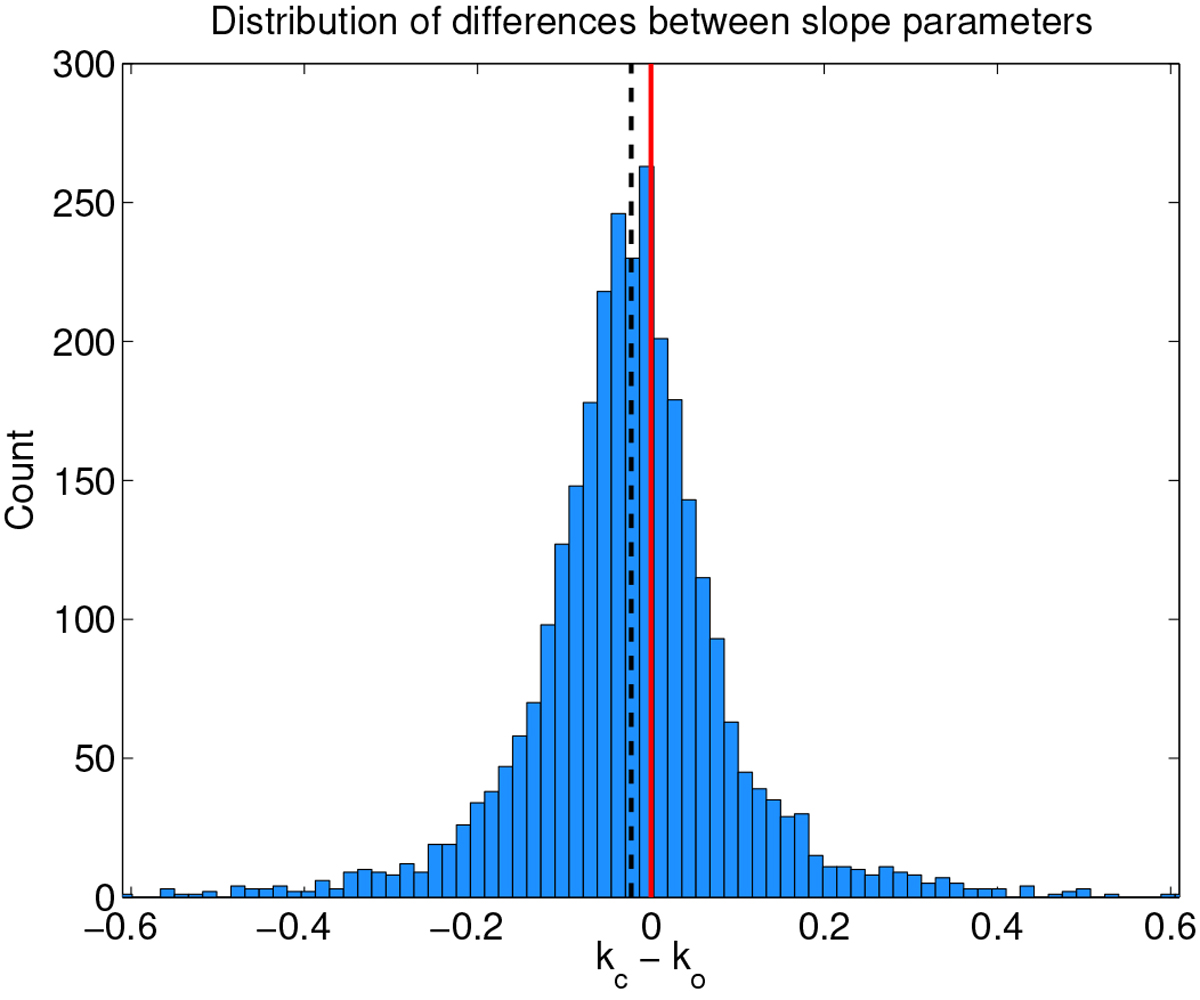
Histogram of differences between slope parameters kc and ko for cyan and orange filters. The red vertical line emphasizes that the distribution is not centered at zero, but shifted to the left. The black dashed line marks the mean value of kc − ko = −0.023.
Current usage metrics show cumulative count of Article Views (full-text article views including HTML views, PDF and ePub downloads, according to the available data) and Abstracts Views on Vision4Press platform.
Data correspond to usage on the plateform after 2015. The current usage metrics is available 48-96 hours after online publication and is updated daily on week days.
Initial download of the metrics may take a while.