Open Access
Fig. C.2.
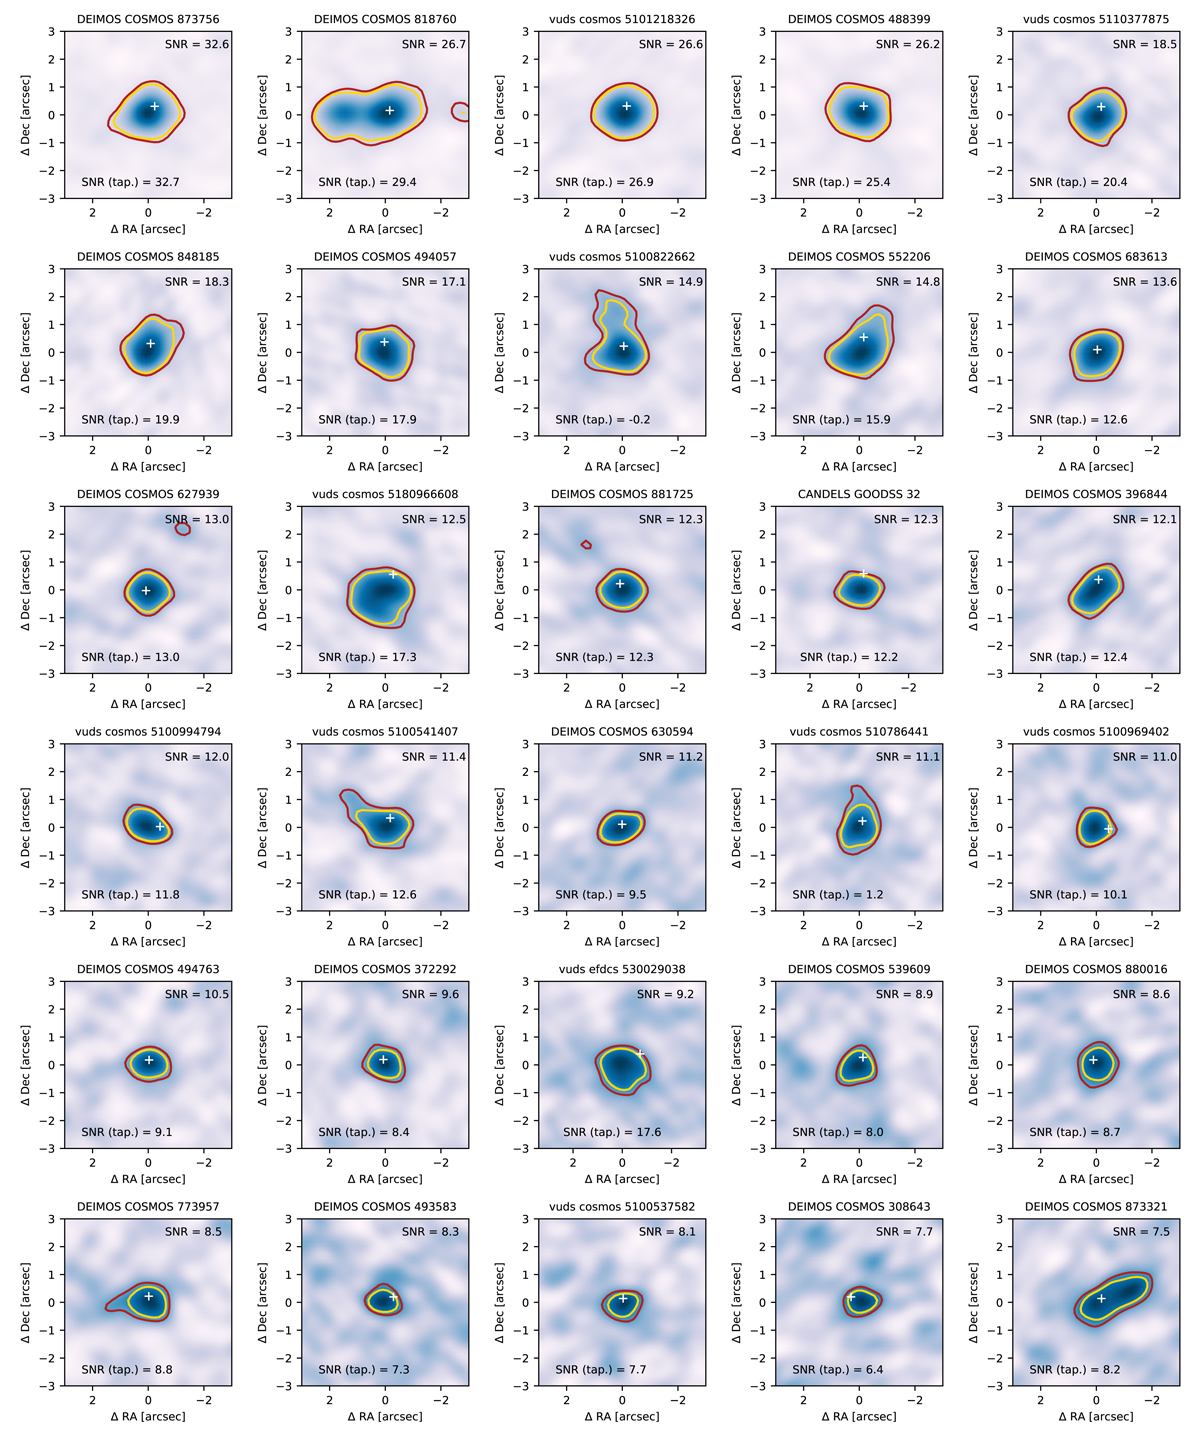
Cutout images of the moment-0 maps of our detected [CII] targets. The red and the gold contours indicate the 3.5σ and 5σ levels, respectively. The white crosshair indicate the phase center. The sources are ordered by decreasing S/N.
Current usage metrics show cumulative count of Article Views (full-text article views including HTML views, PDF and ePub downloads, according to the available data) and Abstracts Views on Vision4Press platform.
Data correspond to usage on the plateform after 2015. The current usage metrics is available 48-96 hours after online publication and is updated daily on week days.
Initial download of the metrics may take a while.