Fig. 18.
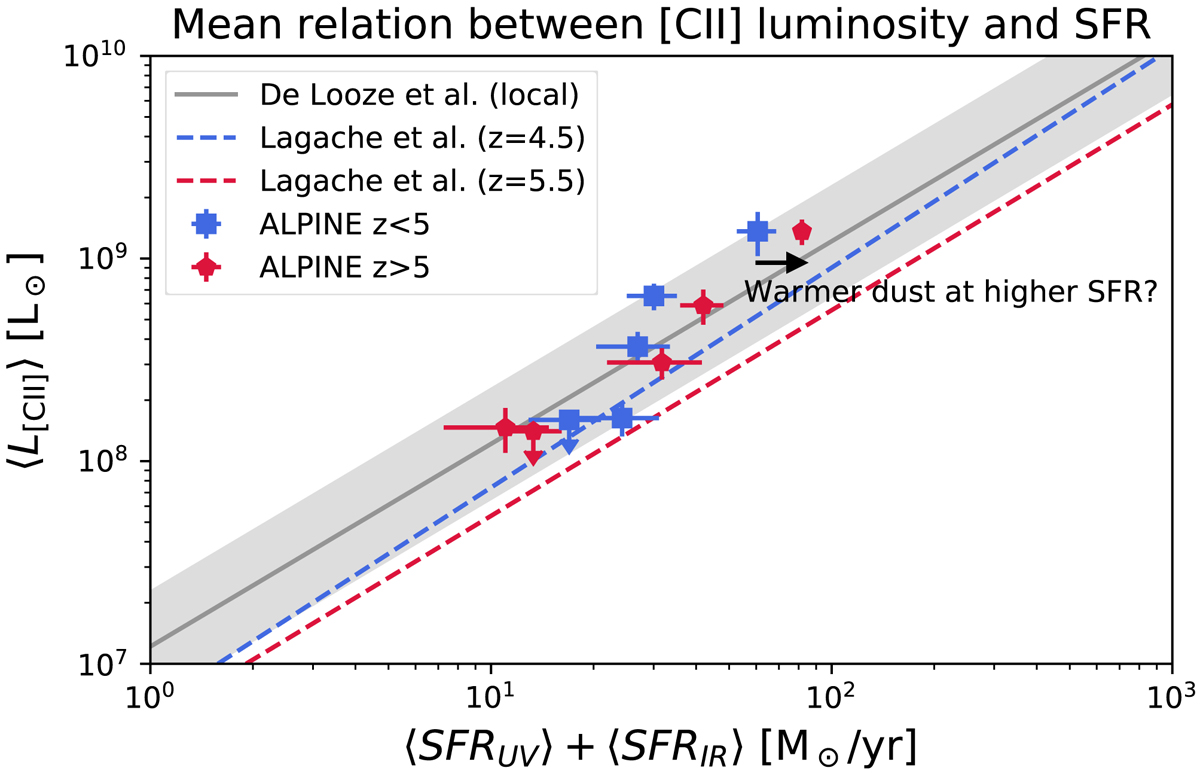
Mean [CII] luminosity as a function of SFR. The obscured SFR is measured by stacking the ALPINE continuum maps for various subsamples selected in redshift and [CII] luminosity. It is combined with the mean uncorrected UV SFR from ancillary data (Faisst et al. 2020). The method is described in Sect. 7.5. The blue squares are our measurements at z < 5 and the red diamonds are for z > 5. The y-axis upper limits correspond to the mean total SFR of nondetected [CII] samples (the y position corresponds to mean of the secure [CII] upper limits). The blue and red dashed lines indicate the relation of Lagache et al. (2018) at z = 4.5 and z = 5.5, respectively. The gray shaded area is the 1-σ region of the relation of De Looze et al. (2014). The black arrow represents the shift in SFR if we use the warmer Schreiber et al. (2018) SED templates instead of the Bethermin et al. (2017) ones to determine the infrared luminosity.
Current usage metrics show cumulative count of Article Views (full-text article views including HTML views, PDF and ePub downloads, according to the available data) and Abstracts Views on Vision4Press platform.
Data correspond to usage on the plateform after 2015. The current usage metrics is available 48-96 hours after online publication and is updated daily on week days.
Initial download of the metrics may take a while.