Fig. 14.
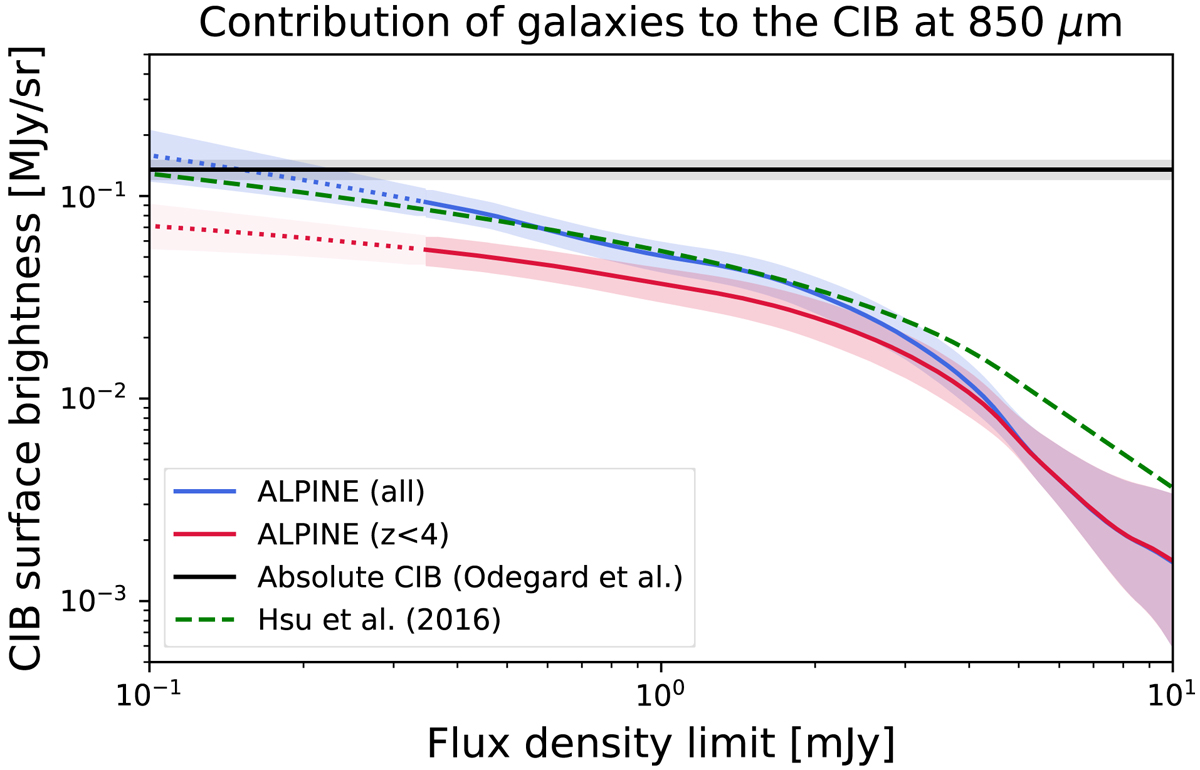
Contribution of galaxies to the cosmic infrared background at 850 μm as a function of the flux density limit. The blue and red solid lines are our results based on the full and the secure z < 4 samples, respectively. The shaded area is the 1-σ confidence region. The dashed green line is the measurement of Hsu et al. (2016) using SCUBA2 data of cluster fields. The black line is the absolute measurement of the total CIB combining COBE/FIRAS and Planck data (Odegard et al. 2019).
Current usage metrics show cumulative count of Article Views (full-text article views including HTML views, PDF and ePub downloads, according to the available data) and Abstracts Views on Vision4Press platform.
Data correspond to usage on the plateform after 2015. The current usage metrics is available 48-96 hours after online publication and is updated daily on week days.
Initial download of the metrics may take a while.