Fig. 13.
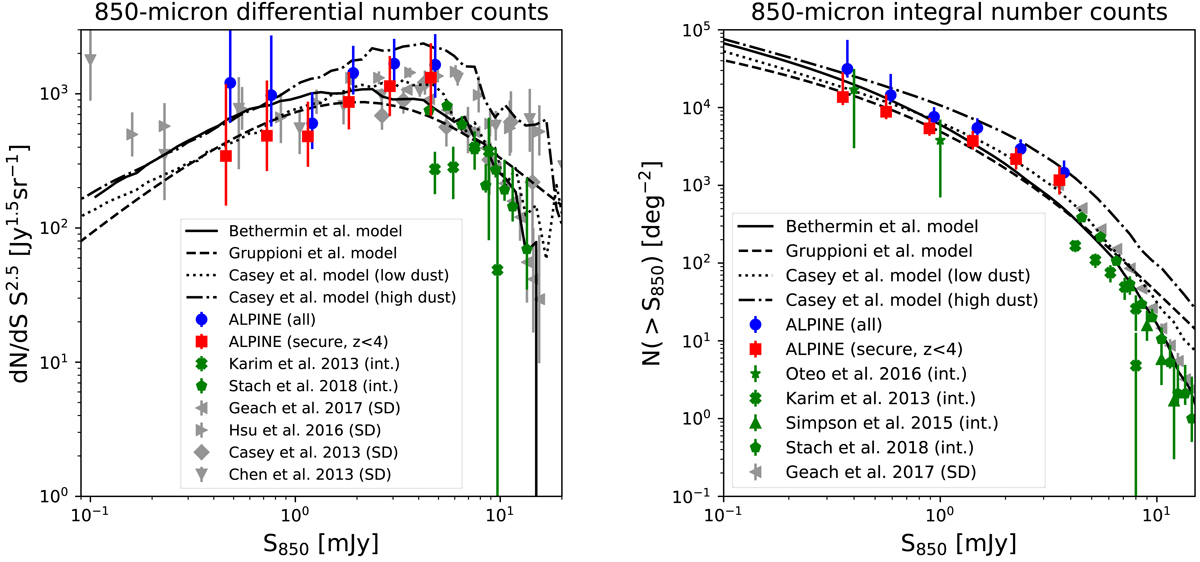
Left panel: differential number counts at 850 μm. The blue circles are the counts derived from the full ALPINE nontarget sample. The red squares are computed from the ALPINE nontarget sources with a confirmed optical or near-IR counterpart below z = 4 (secure z < 4 sample). It is thus a secure lower limit, since sources clustered with ALPINE sources are excluded. The green crosses and pentagons are the interferometric measurements of Karim et al. (2013) and Stach et al. (2018), respectively. The gray left-facing triangles, right-facing triangles, diamonds, and down-facing triangles are the measurements performed using single-dish data with a lower angular resolution by Geach et al. (2017), Hsu et al. (2016), Casey et al. (2013), and Chen et al. (2013), respectively. The solid, dashed, dotted, and dash-dot lines are the models of Bethermin et al. (2017, SIDES simulation), Gruppioni et al. (2011), Casey et al. (2018, low dust), and Casey et al. (2018, high dust). Right panel: integral number counts at 850 μm. The symbols are the same as in the left panel. The interferometric measurements of Oteo et al. (2016) and Simpson et al. (2015), respectively, are represented by green stars and triangles.
Current usage metrics show cumulative count of Article Views (full-text article views including HTML views, PDF and ePub downloads, according to the available data) and Abstracts Views on Vision4Press platform.
Data correspond to usage on the plateform after 2015. The current usage metrics is available 48-96 hours after online publication and is updated daily on week days.
Initial download of the metrics may take a while.