Fig. 8
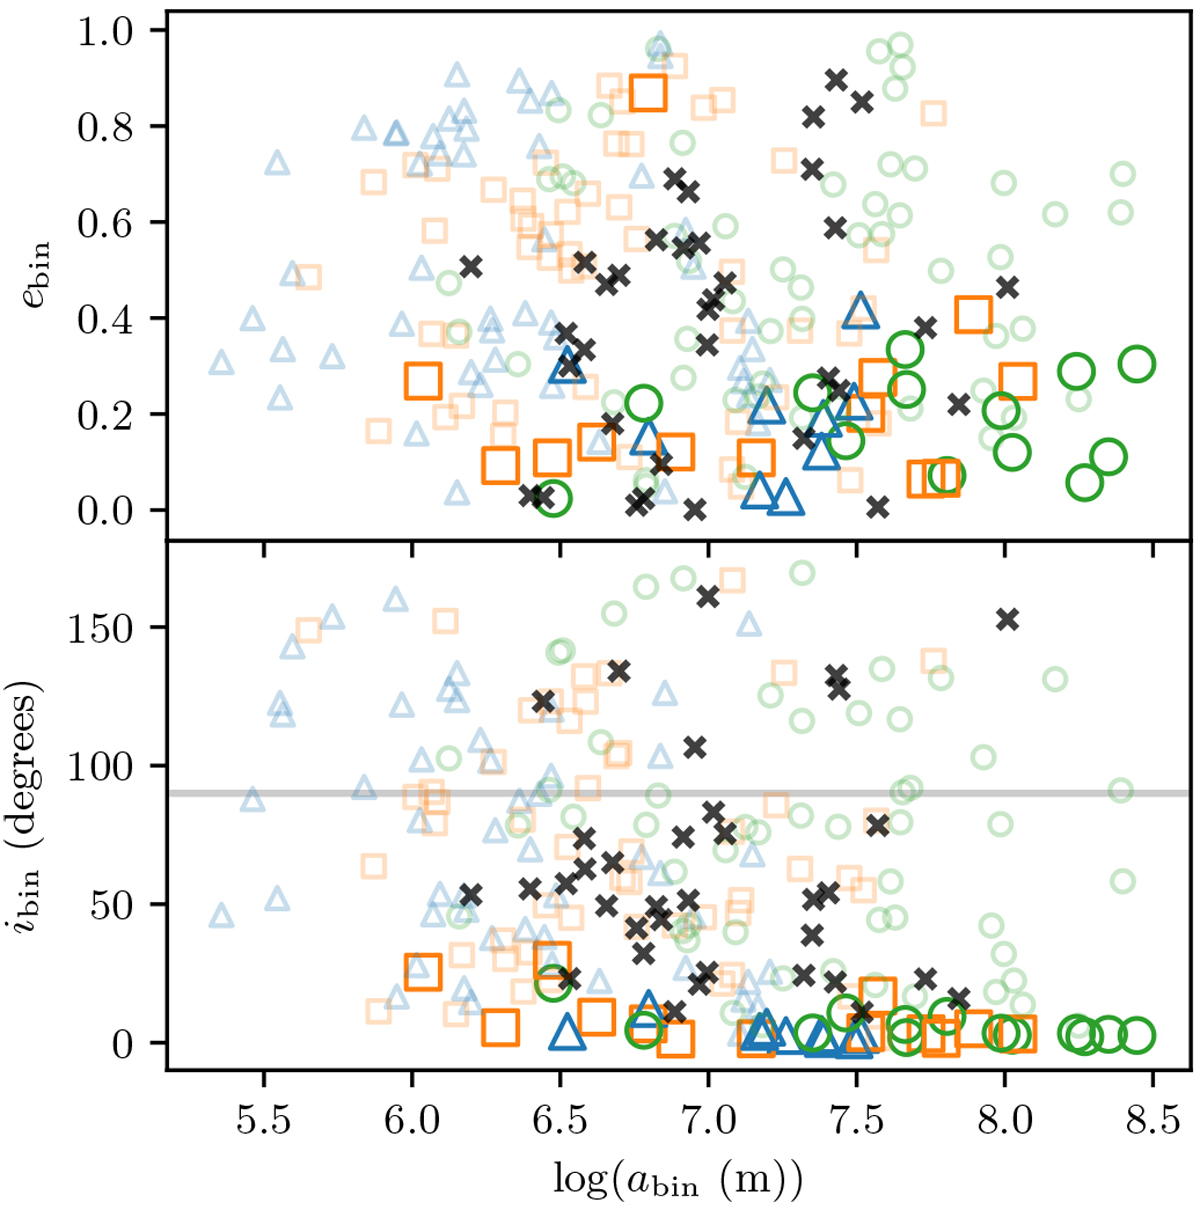
Binary orbital parameters for the simulated binaries compared to the 35 observed TNBs (black crosse s) with full orbit solutions (Grundy et al. 2019, Table 19). Again, marker shape and colour represent the cloud masses (Fig. 2), but here we use larger bold points to highlight systems with m2 ∕m1 > 0.1 and (m2 + m1)∕Mc > 0.1, i.e. the observable binary systems. The smaller faint points represent all other systems in the dataset, i.e. the satellite systems andatomistic binaries.
Current usage metrics show cumulative count of Article Views (full-text article views including HTML views, PDF and ePub downloads, according to the available data) and Abstracts Views on Vision4Press platform.
Data correspond to usage on the plateform after 2015. The current usage metrics is available 48-96 hours after online publication and is updated daily on week days.
Initial download of the metrics may take a while.