Fig. 7
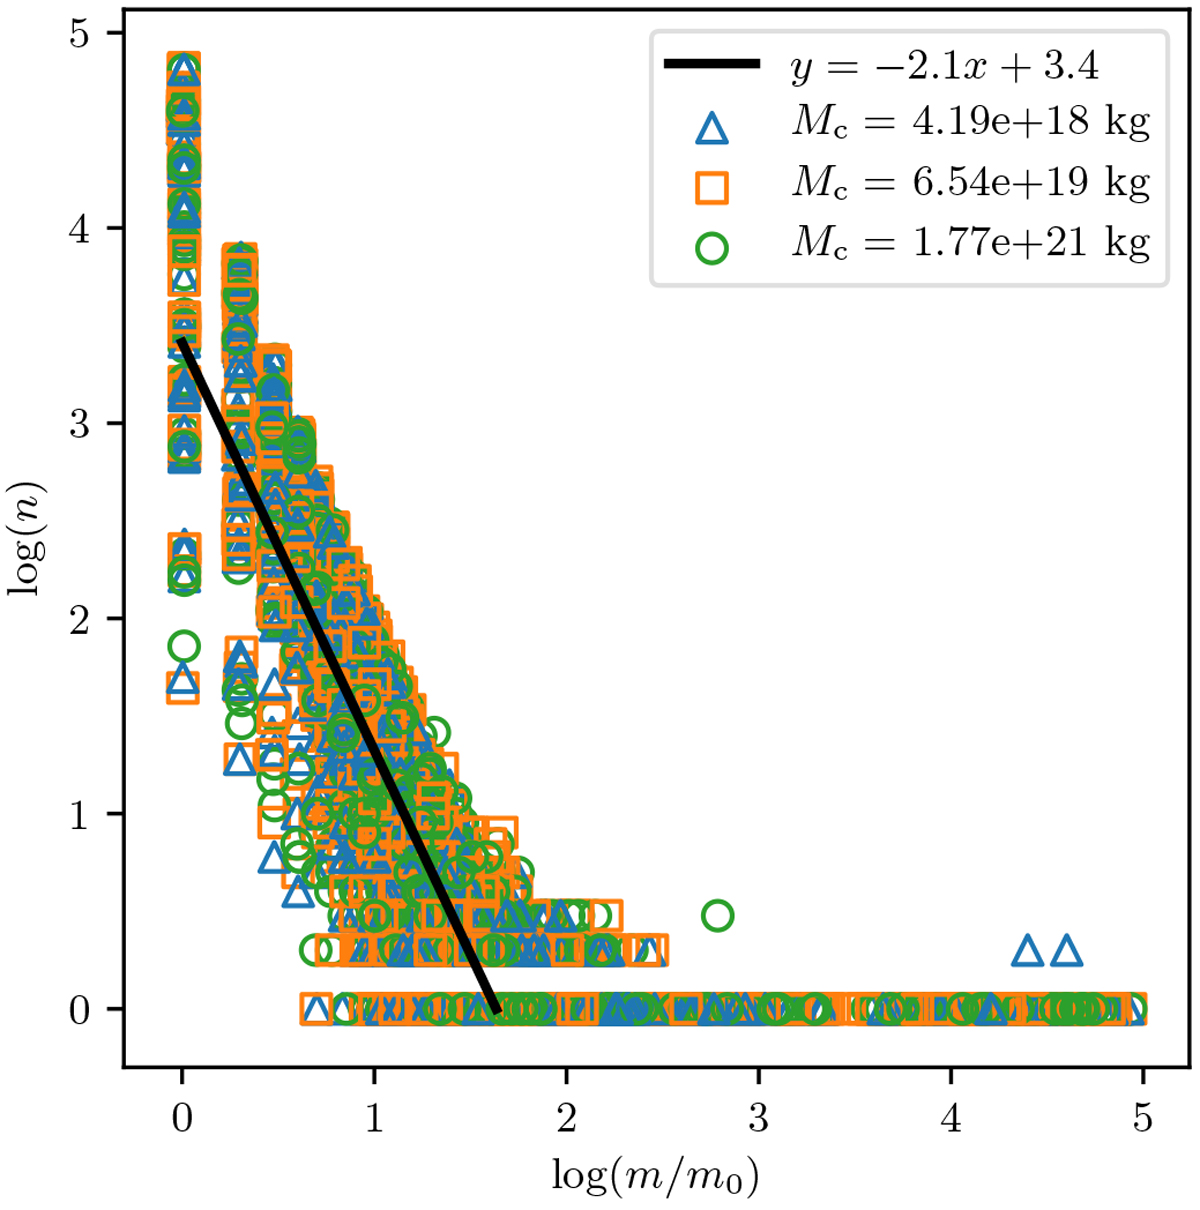
Mass distribution of all particles in the simulation box at t = 100 yr. The number of particles n of mass m, in units of the initial particle mass m0 = Mc∕Np, are shown inlog–log space. Marker colour and shape denote the three cloud masses. A linear regression on all data points with log(m∕m0) < 2 is shown to guide the eye to the power-law distribution.
Current usage metrics show cumulative count of Article Views (full-text article views including HTML views, PDF and ePub downloads, according to the available data) and Abstracts Views on Vision4Press platform.
Data correspond to usage on the plateform after 2015. The current usage metrics is available 48-96 hours after online publication and is updated daily on week days.
Initial download of the metrics may take a while.