Fig. 6
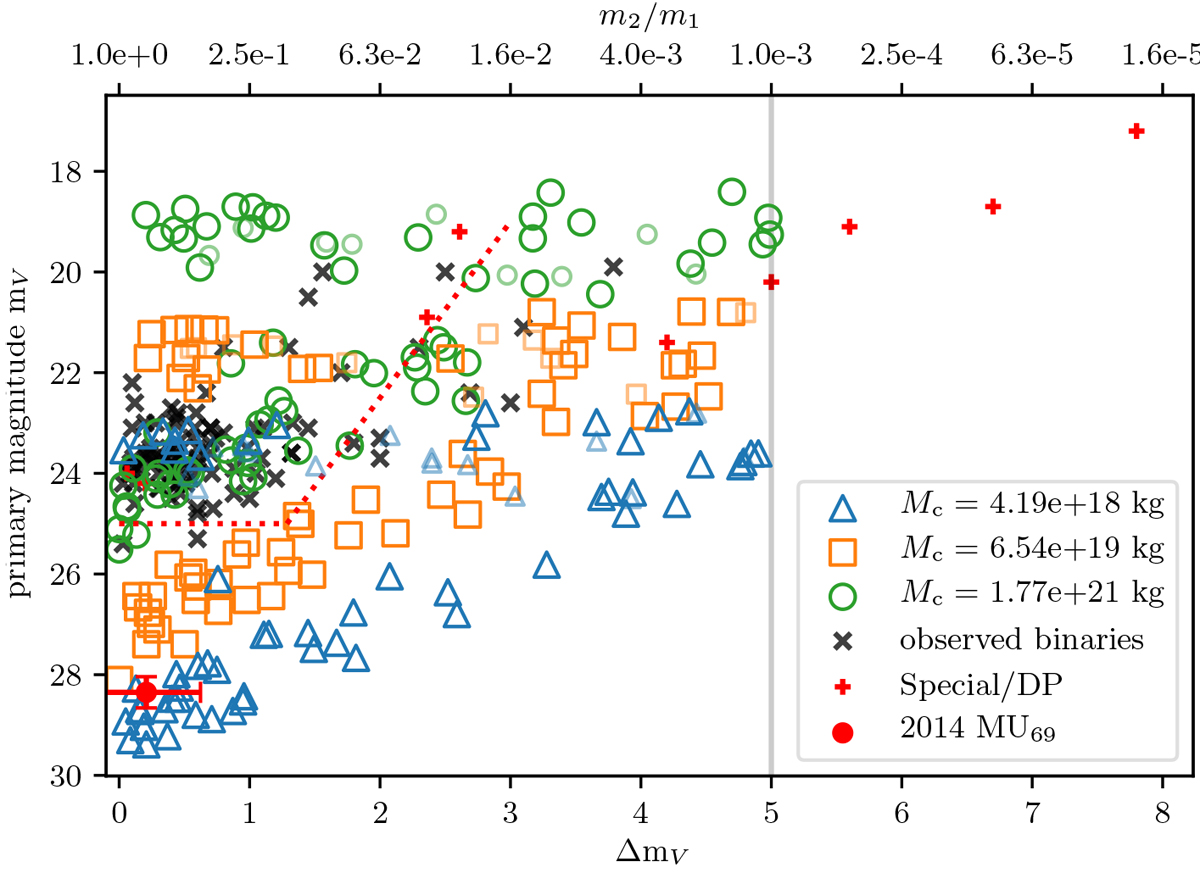
Primary V -band magnitude against magnitude difference between primary and secondary for binaries produced by gravitational-collapse simulations. Particle masses were converted into a spherical radius (assuming uniform density), which was then converted into a magnitude using a fixed albedo and distance. As with Fig. 2, marker colour and shape indicate the initial cloud mass, and any N > 2 systems are represented by smaller, fainter markers. The mass ratio for a given magnitude difference is shown on the upper x-axis. The vertical line indicates the mass ratio cut-off of m2∕m1 ≥ 10−3 in the orbit-search algorithm. The observed TNBs from Grundy (2019) are shown as black crosses. We represent “special cases” and dwarf planets as red plusses. The red circle with error bars represents how Arrokoth (2014 MU69) would appear if its components could be separately resolved. An approximate empirical detection limit (Noll et al. 2008) and a lower magnitude limit of 25 are shown as dotted red lines.
Current usage metrics show cumulative count of Article Views (full-text article views including HTML views, PDF and ePub downloads, according to the available data) and Abstracts Views on Vision4Press platform.
Data correspond to usage on the plateform after 2015. The current usage metrics is available 48-96 hours after online publication and is updated daily on week days.
Initial download of the metrics may take a while.