Fig. 2
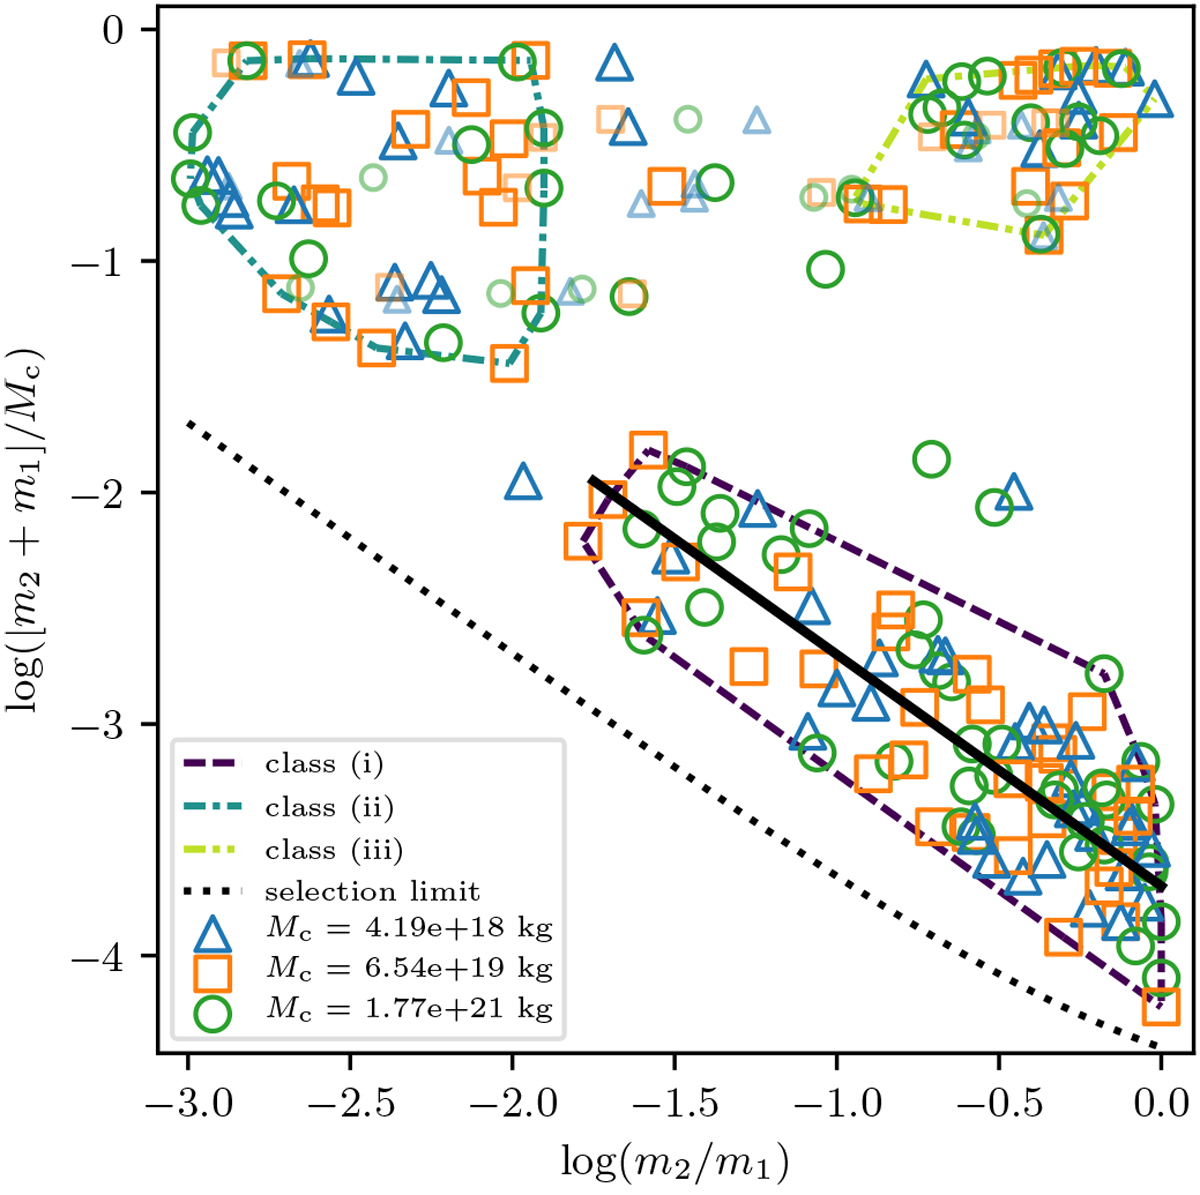
Binary system mass normalised by initial cloud mass (m2 + m1)∕Mc, against the secondary-to-primary mass ratio, m2∕m1, plotted in log–log space. We display the results for all values of Mc, X, and f* in our dataset. Marker colour and shape denote the three initial cloud masses. Dashed coloured lines trace the boundary points of thethree binary classes. The solid line was drawn to guide the eye to the linear trend of the class (i) particles. The detection limit for our orbit search algorithm is shown as the dotted line. We also include data points representative of the N > 2 bound systems. The total mass and mass ratio for the two largest particles in these systems are plotted, represented by the smaller, fainter markers than the binaries.
Current usage metrics show cumulative count of Article Views (full-text article views including HTML views, PDF and ePub downloads, according to the available data) and Abstracts Views on Vision4Press platform.
Data correspond to usage on the plateform after 2015. The current usage metrics is available 48-96 hours after online publication and is updated daily on week days.
Initial download of the metrics may take a while.