Fig. 12
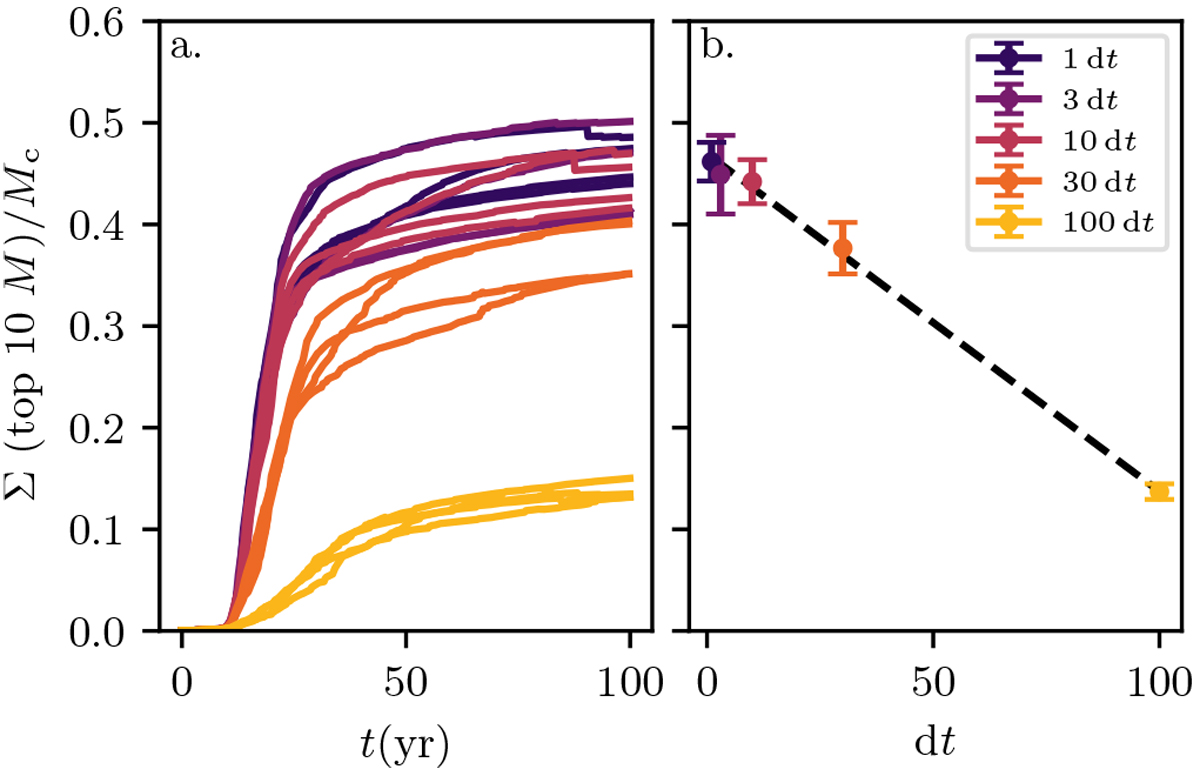
Effect of changing the timestep on mass accretion in a test set of simulations with parameters f* = 30, Mc = 6.54 × 10¹⁹ kg, X = 0.75, and four unique seed positions. This set of four simulations was repeated with the timestep d t increased by factors 1, 3, 10, 30, and 100, as indicated by line and marker colour in both panels. Panel a: total mass of the ten most massive particles in each simulation as a function of time. Panel b: total mass accreted into the ten most massive particles at t = 100 yr, where the error bar markers indicate the mean and standard deviation of each set of four simulations. As the timestep is increased,the mass accretion drops in an approximately linear fashion (dashed line).
Current usage metrics show cumulative count of Article Views (full-text article views including HTML views, PDF and ePub downloads, according to the available data) and Abstracts Views on Vision4Press platform.
Data correspond to usage on the plateform after 2015. The current usage metrics is available 48-96 hours after online publication and is updated daily on week days.
Initial download of the metrics may take a while.