Fig. 21
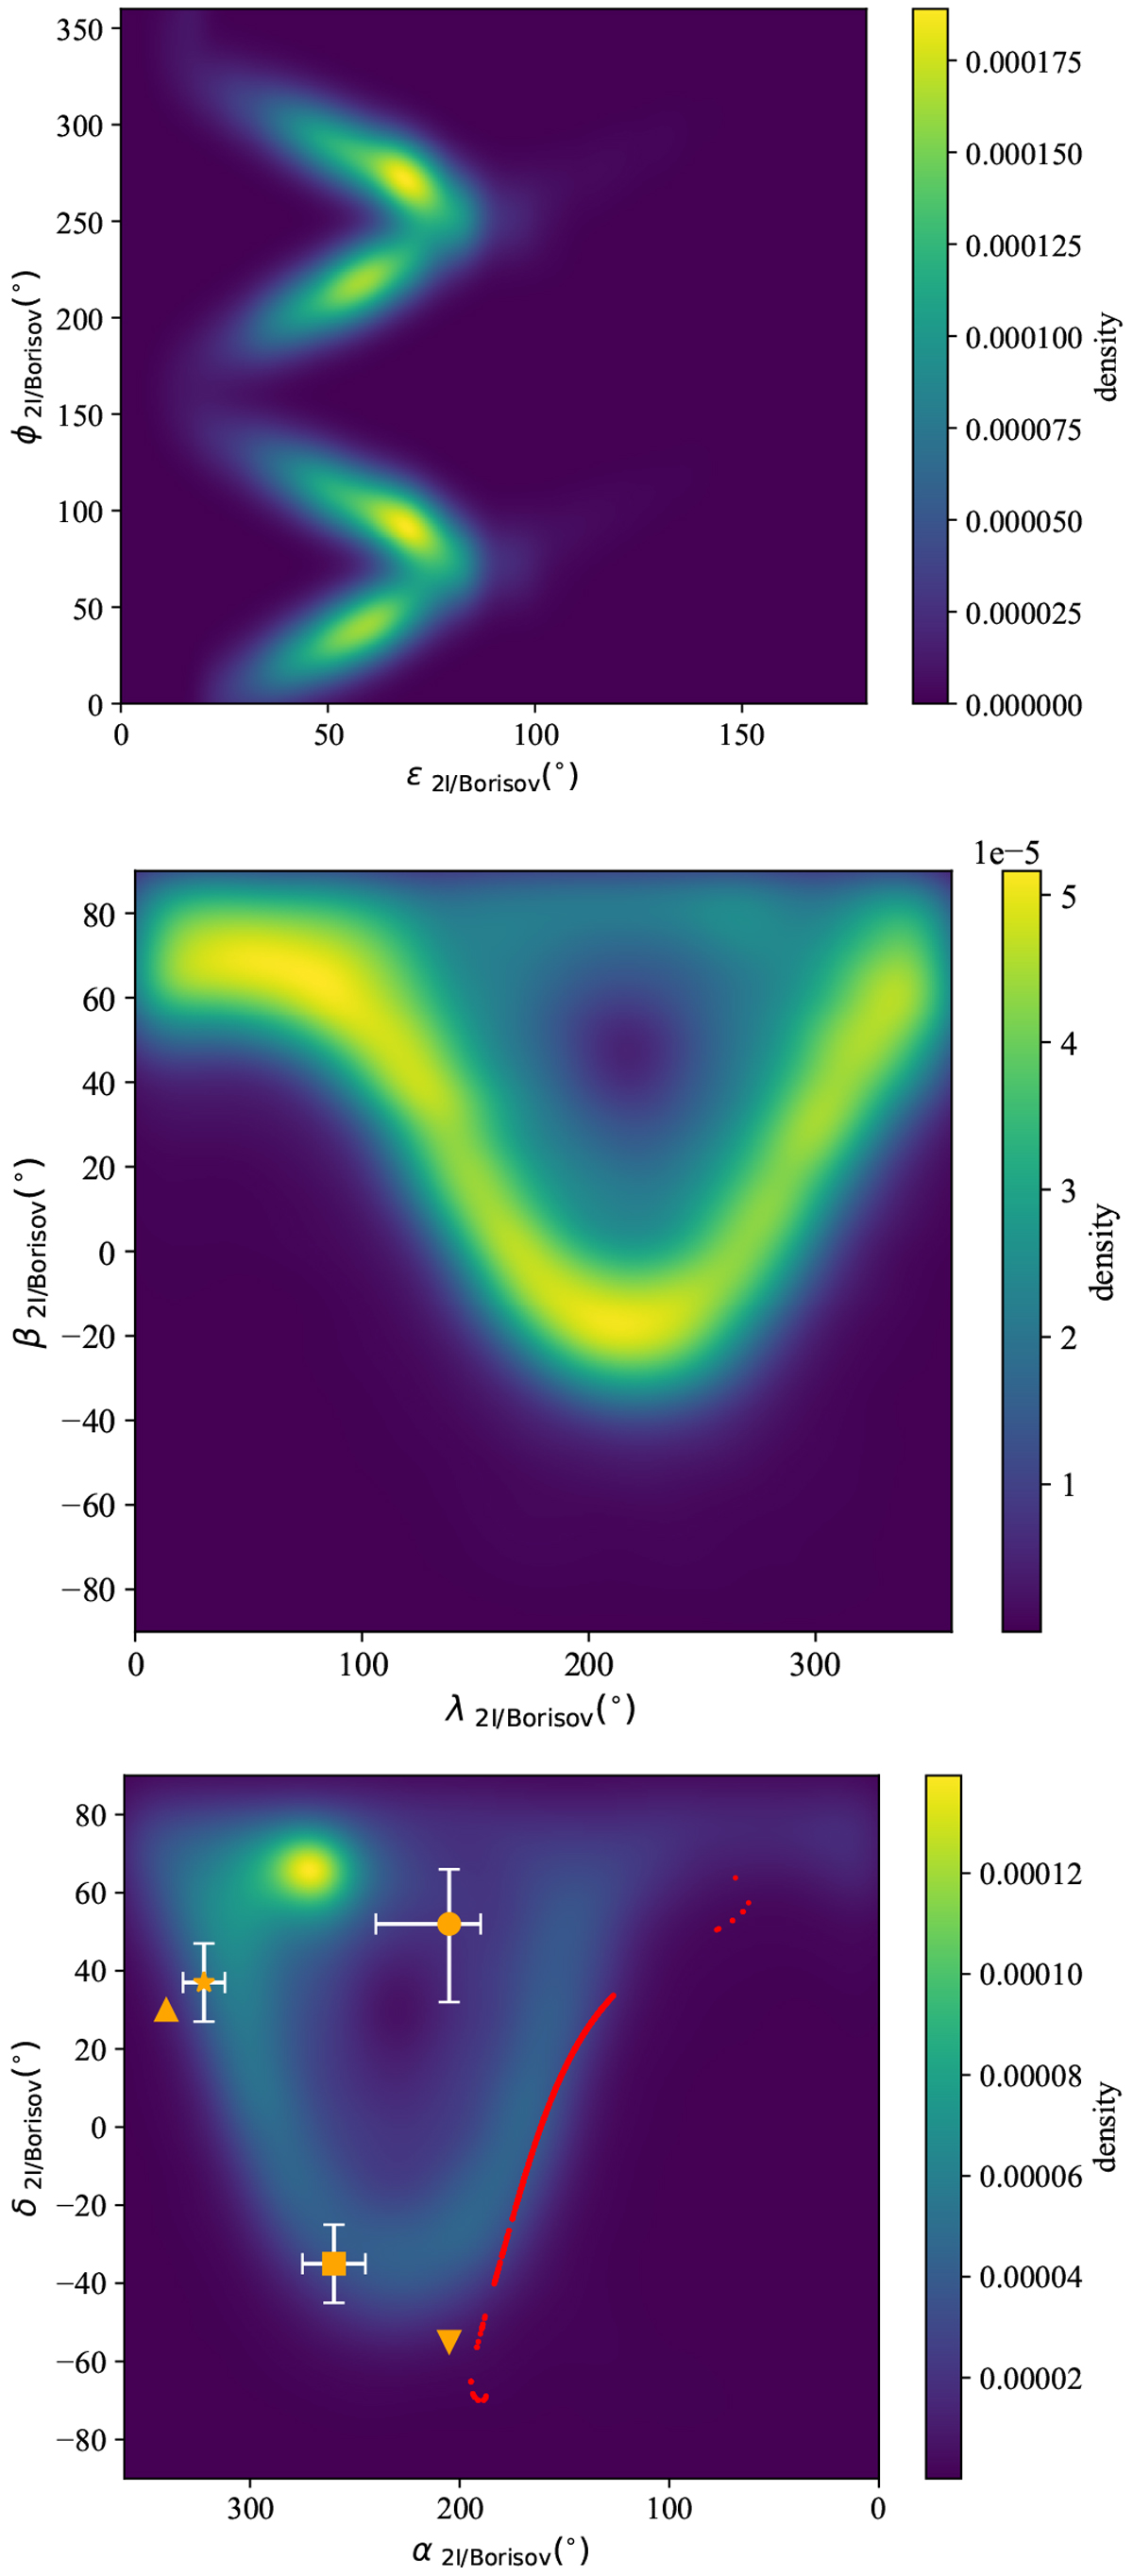
Gaussian kernel density estimation of the spin-axis orientations of 2I/Borisov computed using the SciPylibrary (Virtanen et al. 2020) and based on data from Table 2. Top panel: (ɛc, ϕc) map. The results in ecliptic coordinates, (λp, βp), are shown in the middle panel and those in equatorial coordinates, (αp, δp), are displayed in the bottom panel that includes the actual observations (in red) of 2I/Borisov available from the MPC. Already published spin-axis directions are plotted as filled orange symbols with white error bars (when available): triangles (Ye et al. 2020), square (Manzini et al. 2020), star (Bolin et al. 2020b), and circle (Kim et al. 2020).
Current usage metrics show cumulative count of Article Views (full-text article views including HTML views, PDF and ePub downloads, according to the available data) and Abstracts Views on Vision4Press platform.
Data correspond to usage on the plateform after 2015. The current usage metrics is available 48-96 hours after online publication and is updated daily on week days.
Initial download of the metrics may take a while.