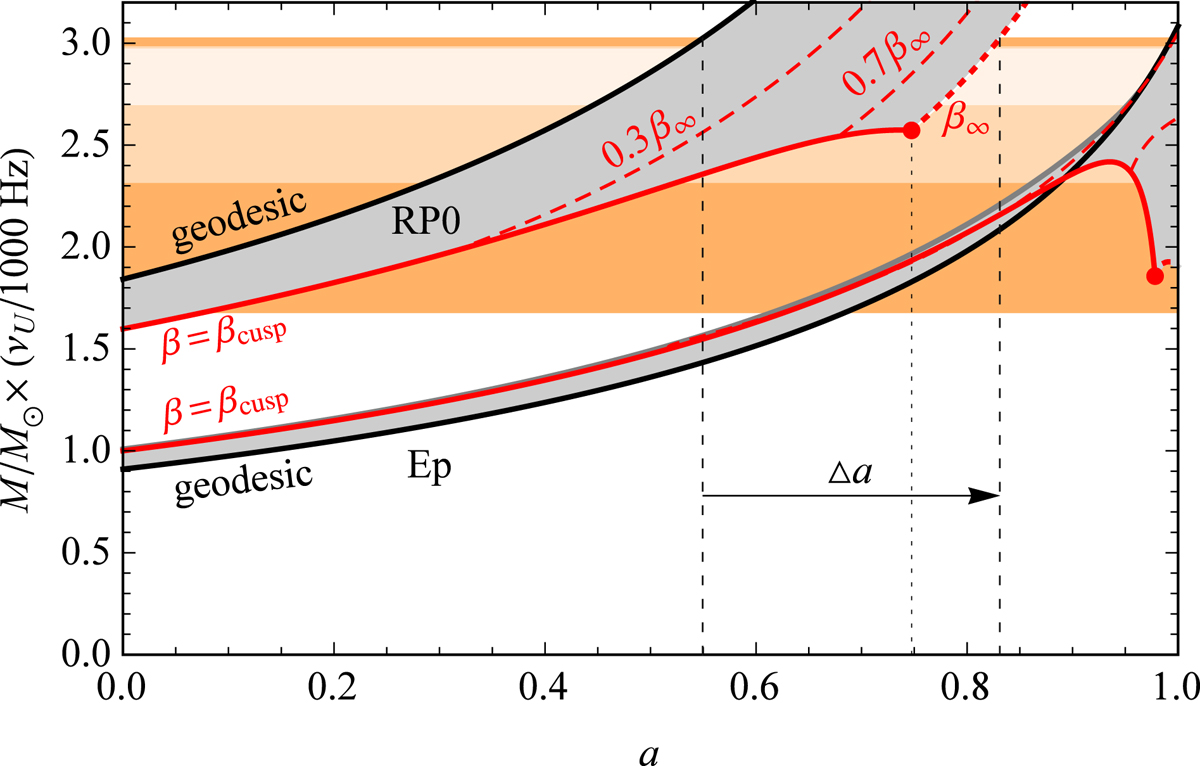
Fig. 5.

M(a) relation implied by the RP0 and Ep models. The thick black curves correspond to the geodesic case, i.e. these are the same curves as those shown in Fig. 2. The grey shaded region indicates the case when β > 0. The thick red curves correspond to β = βcusp and the dotted red curve to β = β∞. The dashed red lines correspond to βeff = β/β∞ = 0.7 and βeff = β/β∞ = 0.3. The black arrow labelled Δa indicates the shift of the upper limit on the spin of microquasars implied by the RP0 model considering the non-geodesic flow (from a ∼ 0.55 to a ∼ 0.83).
Current usage metrics show cumulative count of Article Views (full-text article views including HTML views, PDF and ePub downloads, according to the available data) and Abstracts Views on Vision4Press platform.
Data correspond to usage on the plateform after 2015. The current usage metrics is available 48-96 hours after online publication and is updated daily on week days.
Initial download of the metrics may take a while.


