Fig. 4.
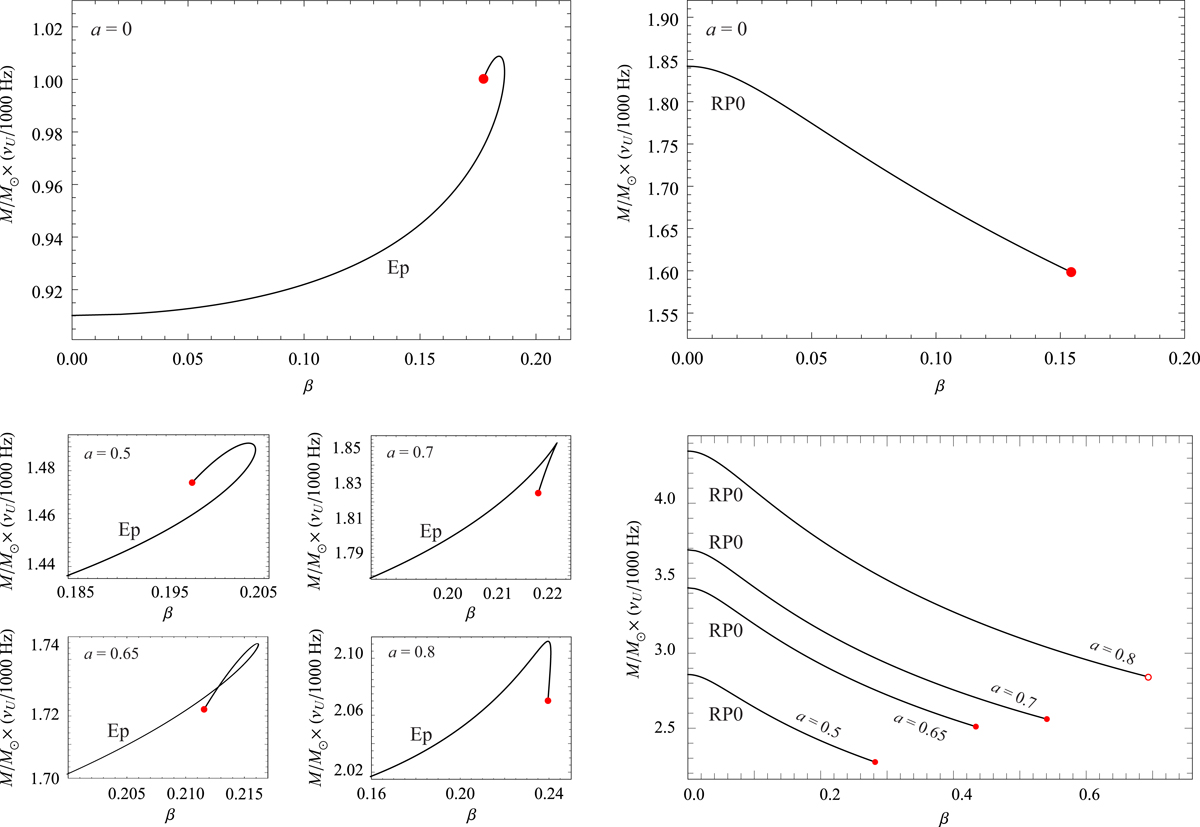
Comparison between the upper QPO frequencies predicted by the Ep and RP0 models. Left: examples of the non-trivial topology of νU(β) curves predicted by the Ep model. Except for the a = 0 case, we do not display the whole effective range of β ∈ [0, βcusp]; the overall increase of νU is rather small for any a ≲ 0.9. Right: monotonic behaviour of νU(β) functions predicted by the RP0 model. The values of a are the same as in the left panel. In both panels, the red dots correspond to β = βcusp. The empty red circle denotes β = β∞.
Current usage metrics show cumulative count of Article Views (full-text article views including HTML views, PDF and ePub downloads, according to the available data) and Abstracts Views on Vision4Press platform.
Data correspond to usage on the plateform after 2015. The current usage metrics is available 48-96 hours after online publication and is updated daily on week days.
Initial download of the metrics may take a while.