Fig. 3.
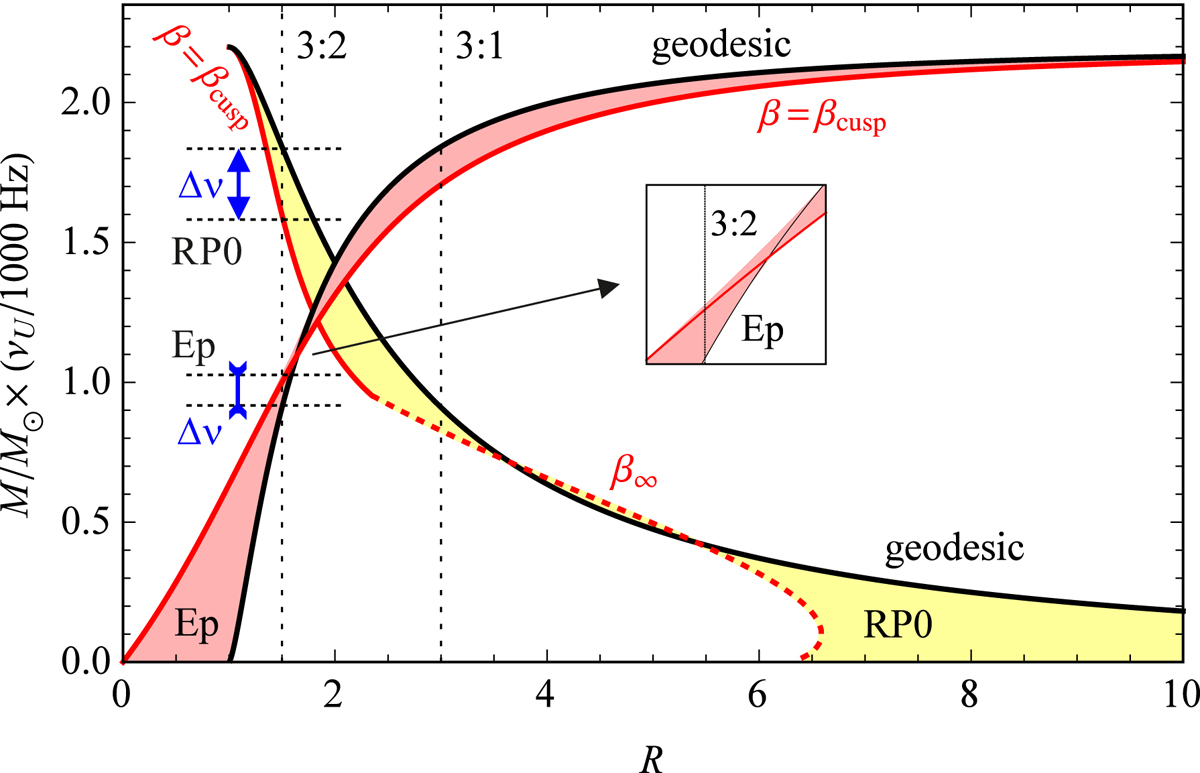
Upper QPO frequency predicted by the Ep and RP0 model plotted for a = 0 and tori whose thickness ranges from an infinitely slender torus (β = 0, black line) through a torus with a cusp (β = βcusp, red line) to a torus whose outer edge extends to infinity (βeff = 1, dotted red line). The blue arrows indicate the spread of the resonant frequency implied by the allowed spread of β for each model and the 3 : 2 QPO frequency ratio.
Current usage metrics show cumulative count of Article Views (full-text article views including HTML views, PDF and ePub downloads, according to the available data) and Abstracts Views on Vision4Press platform.
Data correspond to usage on the plateform after 2015. The current usage metrics is available 48-96 hours after online publication and is updated daily on week days.
Initial download of the metrics may take a while.