Free Access
Fig. 3.
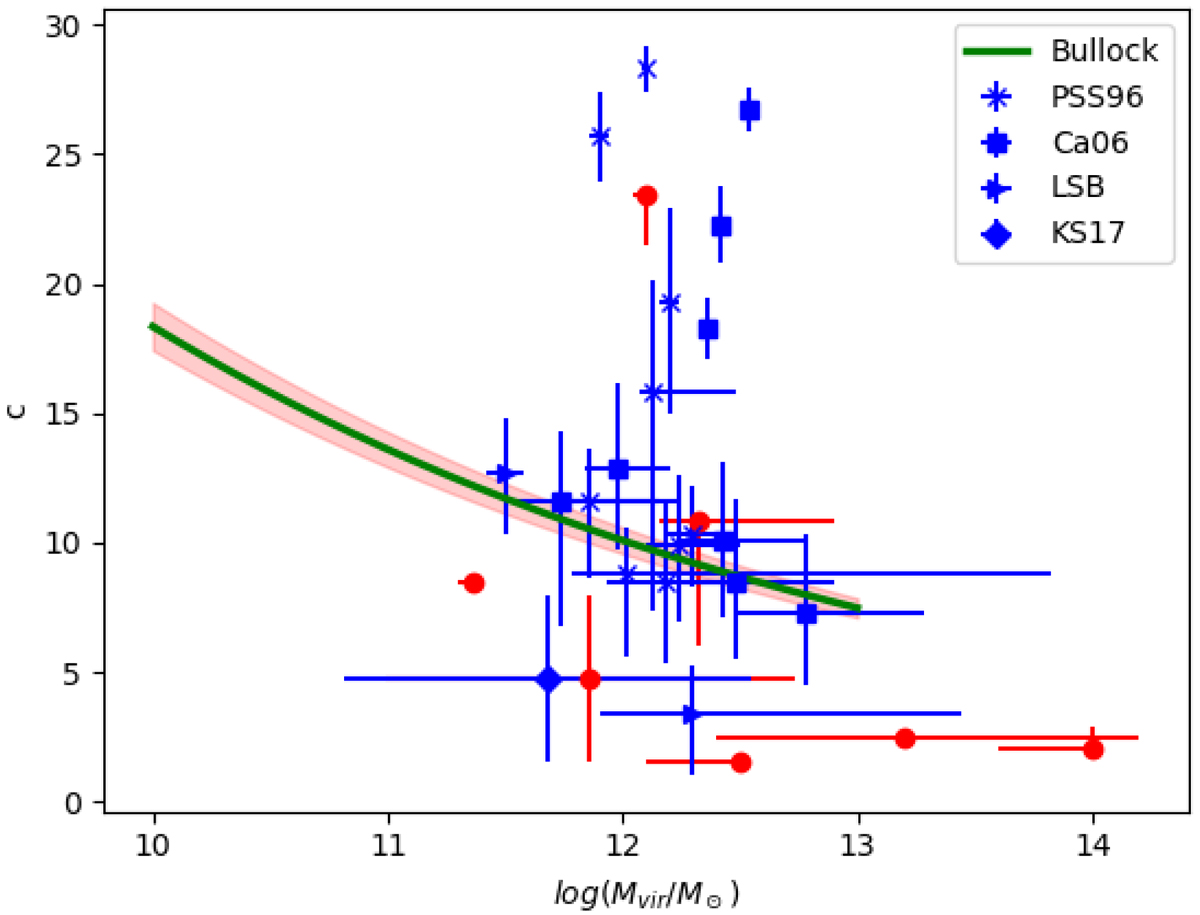
Relation between c and log Mvir from the 26 mass models. Blue points indicate the results of this paper (red points indicate a very large uncertainty on their estimates). The ΛCDM outcome from simulations is also shown (green line).
Current usage metrics show cumulative count of Article Views (full-text article views including HTML views, PDF and ePub downloads, according to the available data) and Abstracts Views on Vision4Press platform.
Data correspond to usage on the plateform after 2015. The current usage metrics is available 48-96 hours after online publication and is updated daily on week days.
Initial download of the metrics may take a while.