Fig. A.7.
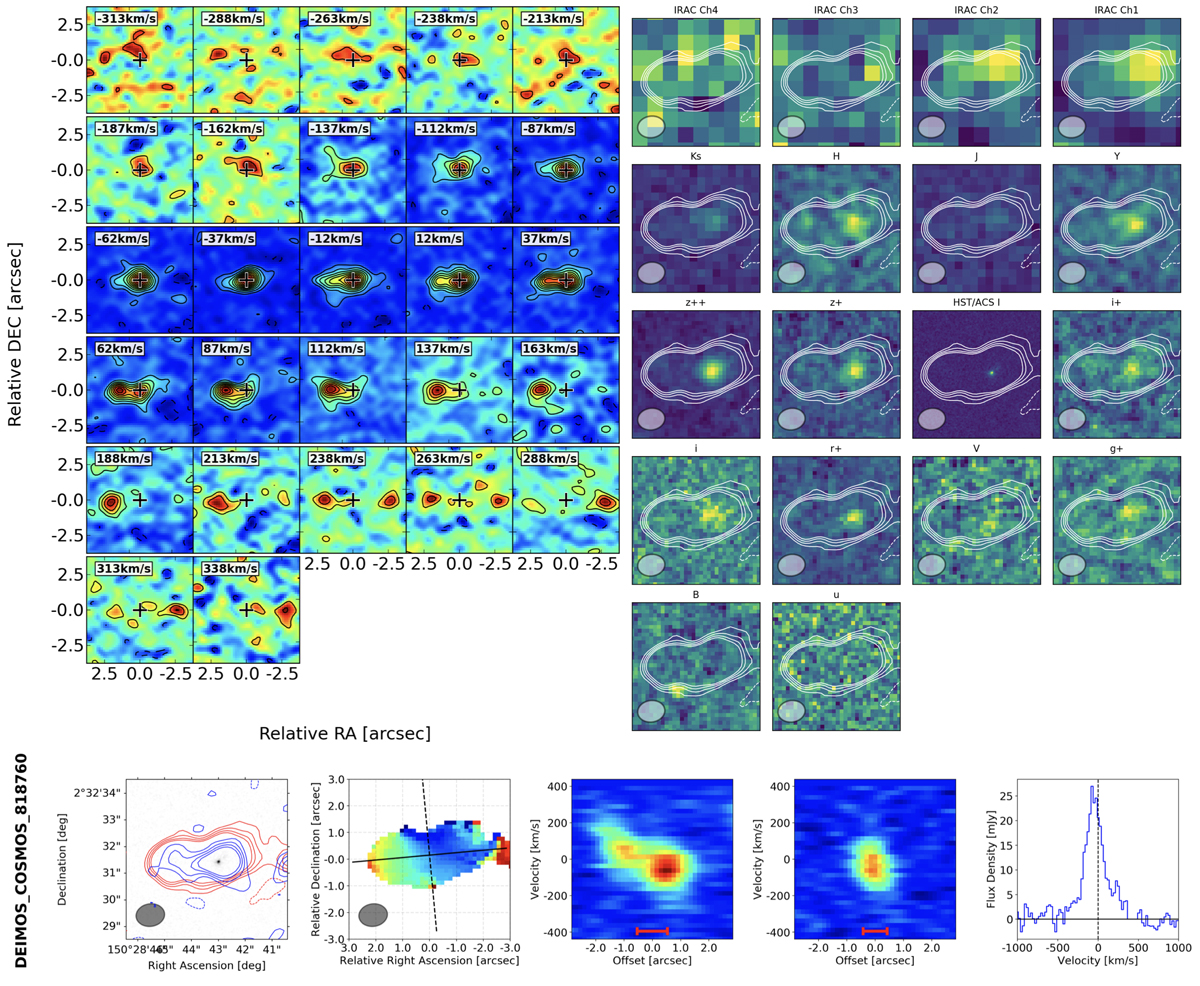
Summary panel with all information available for the classification of galaxies. Top left: velocity channel maps, in 25 km s−1 velocity intervals. Top right: optical and NIR images, with contours from the [CII] emission. Bottom, left to right: flux map in [CII] (red contours) and continuum emission (blue contours) overlaid on top of the i-band F814W HST image; velocity map with major and minor axes used to produce the PV diagram of the next two panels on the right; [CII] line emission in velocity (V = 0 being from the UV-derived spectroscopic redshift). This galaxy has been classified as a merger (Class 2).
Current usage metrics show cumulative count of Article Views (full-text article views including HTML views, PDF and ePub downloads, according to the available data) and Abstracts Views on Vision4Press platform.
Data correspond to usage on the plateform after 2015. The current usage metrics is available 48-96 hours after online publication and is updated daily on week days.
Initial download of the metrics may take a while.