Fig. A.5.
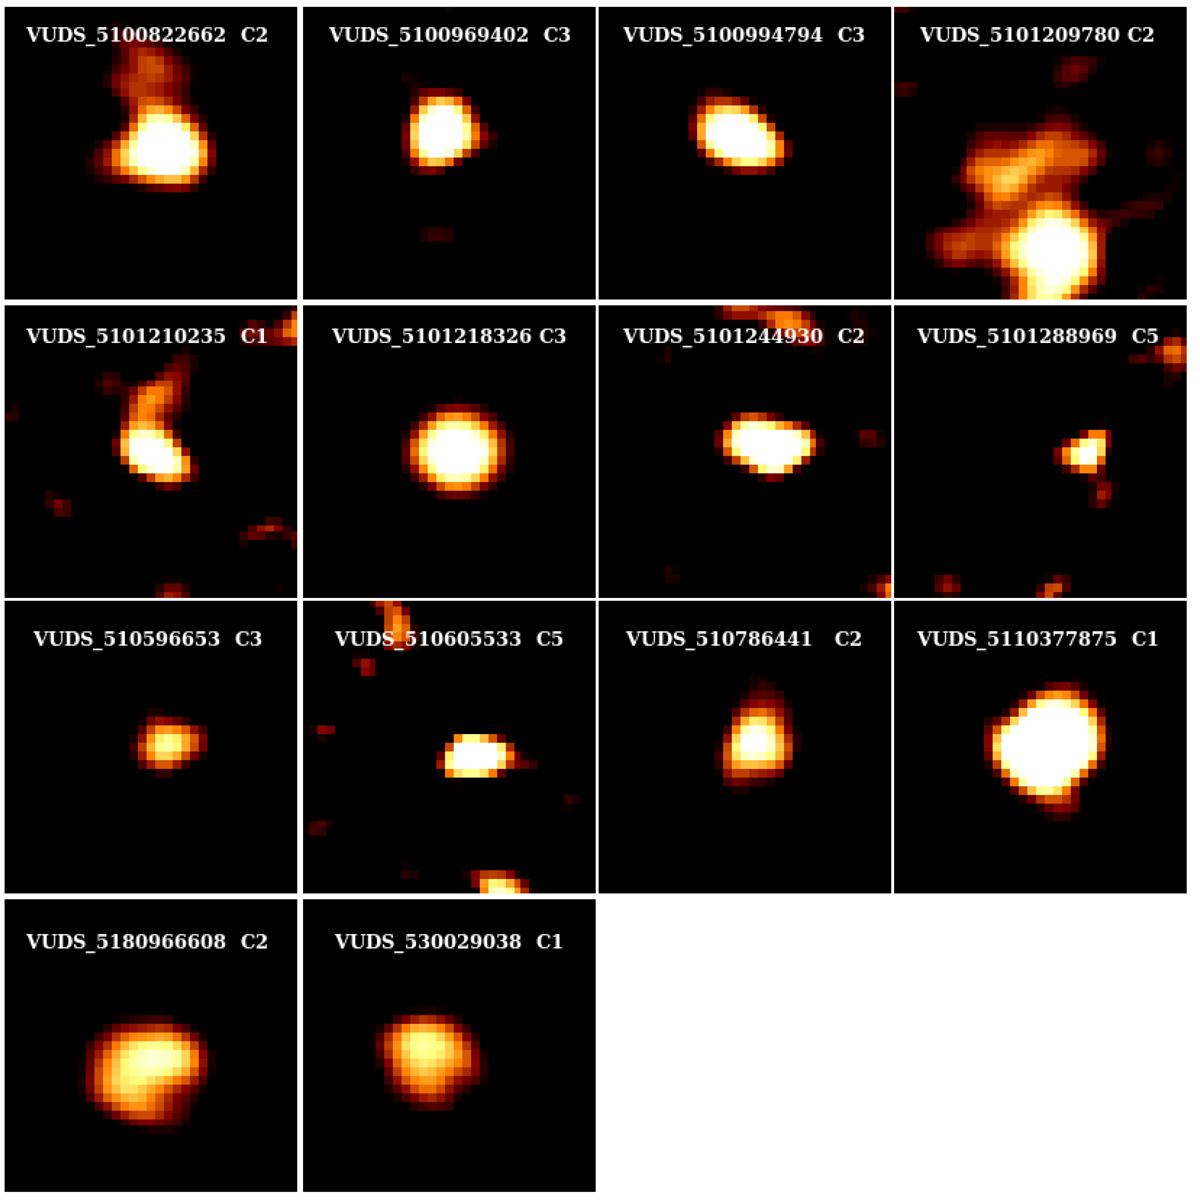
Velocity-integrated [C II] flux maps obtained collapsing the cube channels containing the [C II] line (see text). Each panel is 5″ × 5″ or about 33 × 33 kpc at the mean redshift z = 4.7 of the survey, and centered on the position of the source in the UV rest-frame based on HST-814W images. The object name and morpho-kinematic Class (see Sect. 6) are indicated on top of each sub-panel.
Current usage metrics show cumulative count of Article Views (full-text article views including HTML views, PDF and ePub downloads, according to the available data) and Abstracts Views on Vision4Press platform.
Data correspond to usage on the plateform after 2015. The current usage metrics is available 48-96 hours after online publication and is updated daily on week days.
Initial download of the metrics may take a while.