Fig. 1.
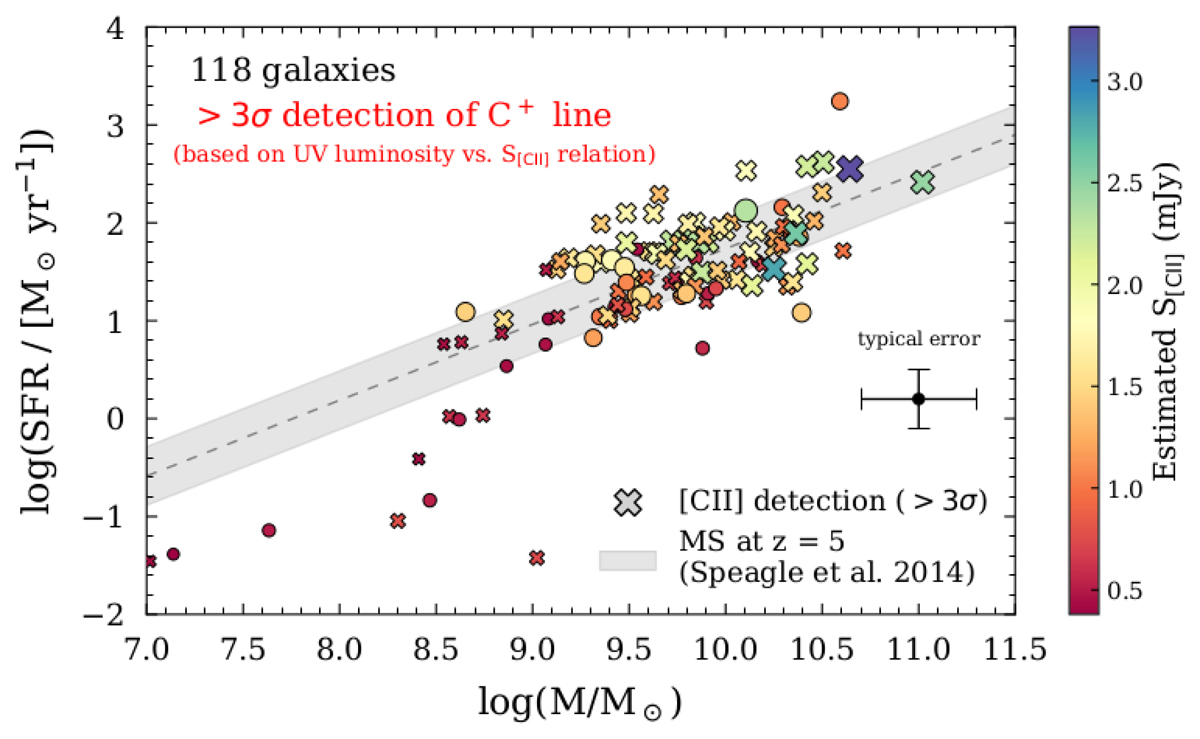
Stellar mass vs. SFR distribution of ALPINE sources as selected prior to ALMA observations, colored by expected [CII] line peak flux estimated from Capak et al. (2015). Mstar and SFR were obtained from SED fitting of the multi-wavelength photometry available at the start of this program (see Faisst et al. 2019 for more details). The cross represents the average 1σ uncertainty. The large proposed sample aims to quantify average trends over a large range of galaxy properties. Those galaxies detected at > 3σ in [CII] are identified with crosses. ALPINE provides [CII] emission line measurements at > 3.5σ for 63% of these galaxies (see text).
Current usage metrics show cumulative count of Article Views (full-text article views including HTML views, PDF and ePub downloads, according to the available data) and Abstracts Views on Vision4Press platform.
Data correspond to usage on the plateform after 2015. The current usage metrics is available 48-96 hours after online publication and is updated daily on week days.
Initial download of the metrics may take a while.