Fig. 8
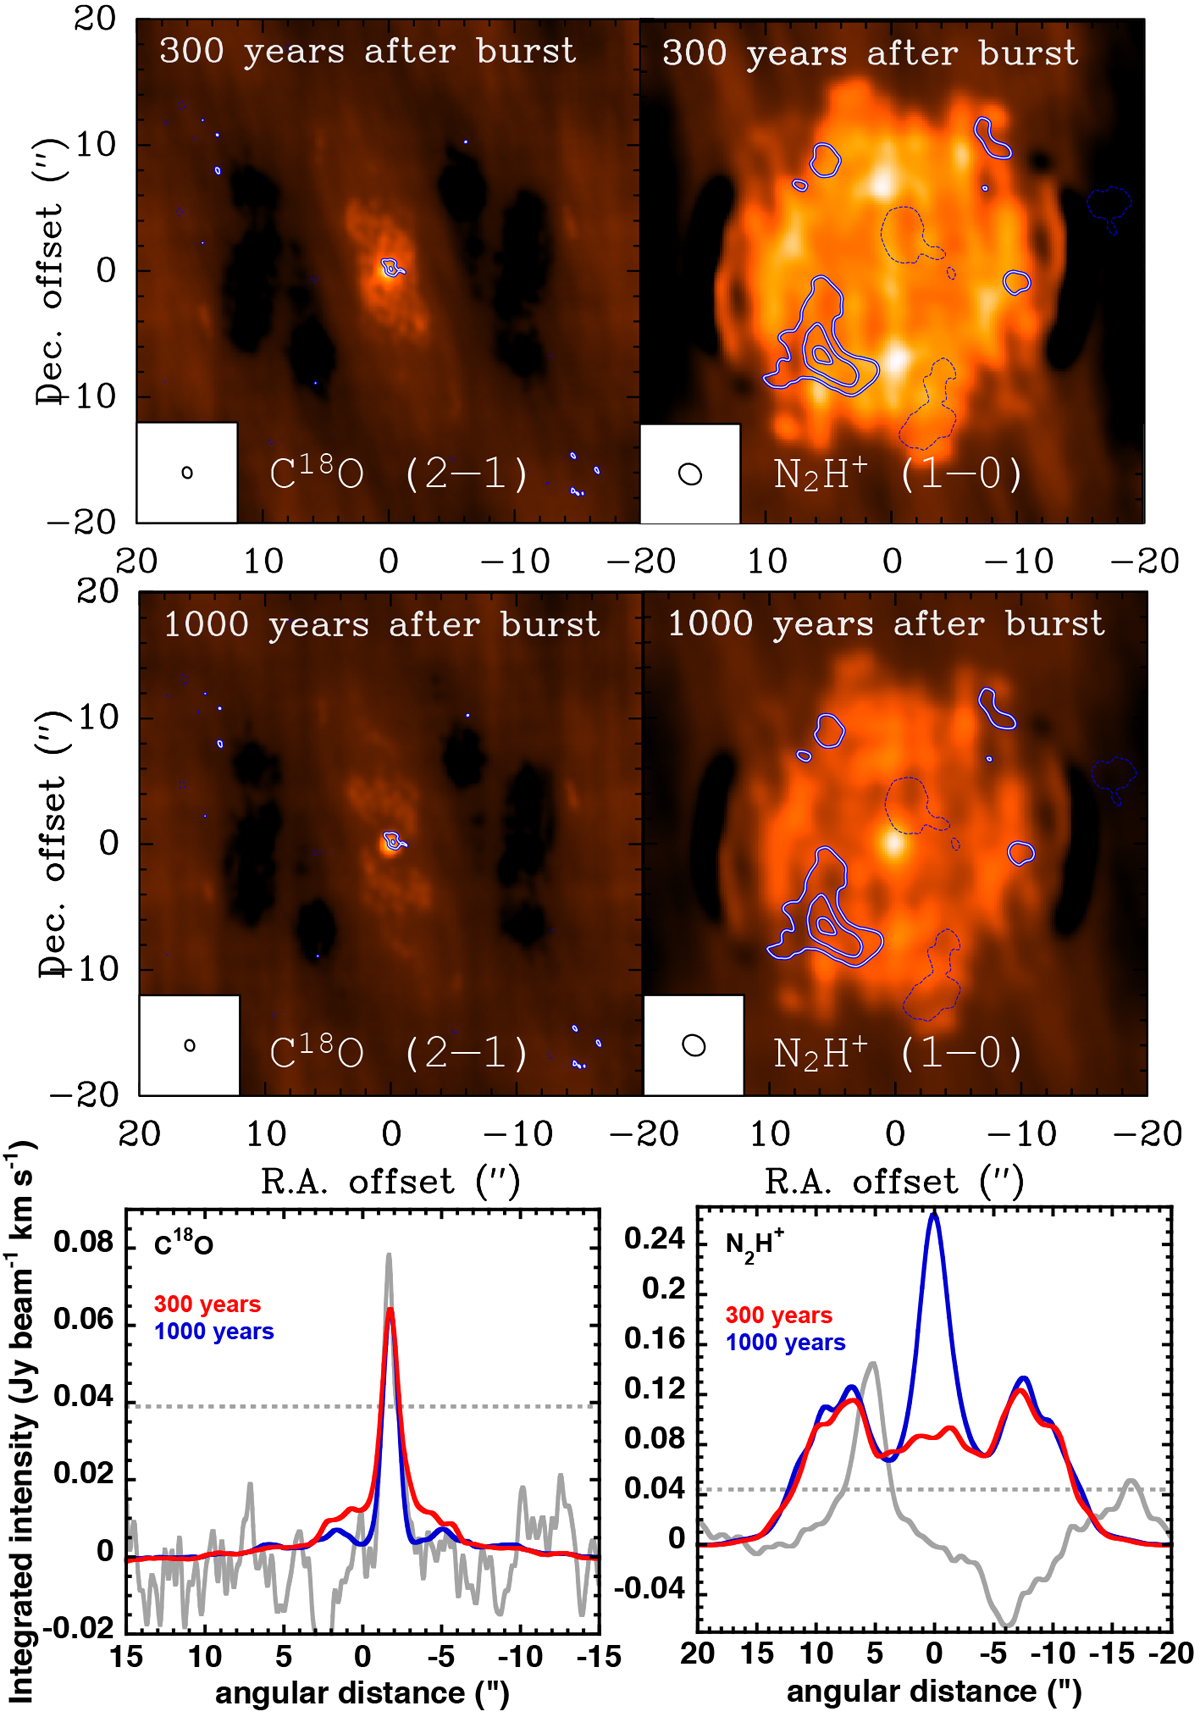
Top and middle panels: C18O (2–1) (left) and N2H+ (1–0) emission (right) according to the time dependent model, 300 yr (top panel) and 1000 yr (middle panel) after the burst. Both panels show comparisons of the observations (contours) with the synthetic maps based on the respective models (color background). Integration intervals and the contour spacing are the same as in Fig. 1. The scaling of the maps can be understood in comparison with the cuts in the bottom panel. Bottom panel: vertical cuts for C18 O (left) and N2H+ (right) 300 (red lines) and 1000 yr (blue lines) after the burst. Gray lines show the data.
Current usage metrics show cumulative count of Article Views (full-text article views including HTML views, PDF and ePub downloads, according to the available data) and Abstracts Views on Vision4Press platform.
Data correspond to usage on the plateform after 2015. The current usage metrics is available 48-96 hours after online publication and is updated daily on week days.
Initial download of the metrics may take a while.